Example
AMZN around earnings
The Most Interesting Volsurface in the World, Part 2
The Most Interesting Volsurface in the World
We’re not sure if Jeff Bezos has a shot at the Most Interesting Man in the World, but AMZN certainly often has one of the Most Interesting Volsurfaces in the World, these days.
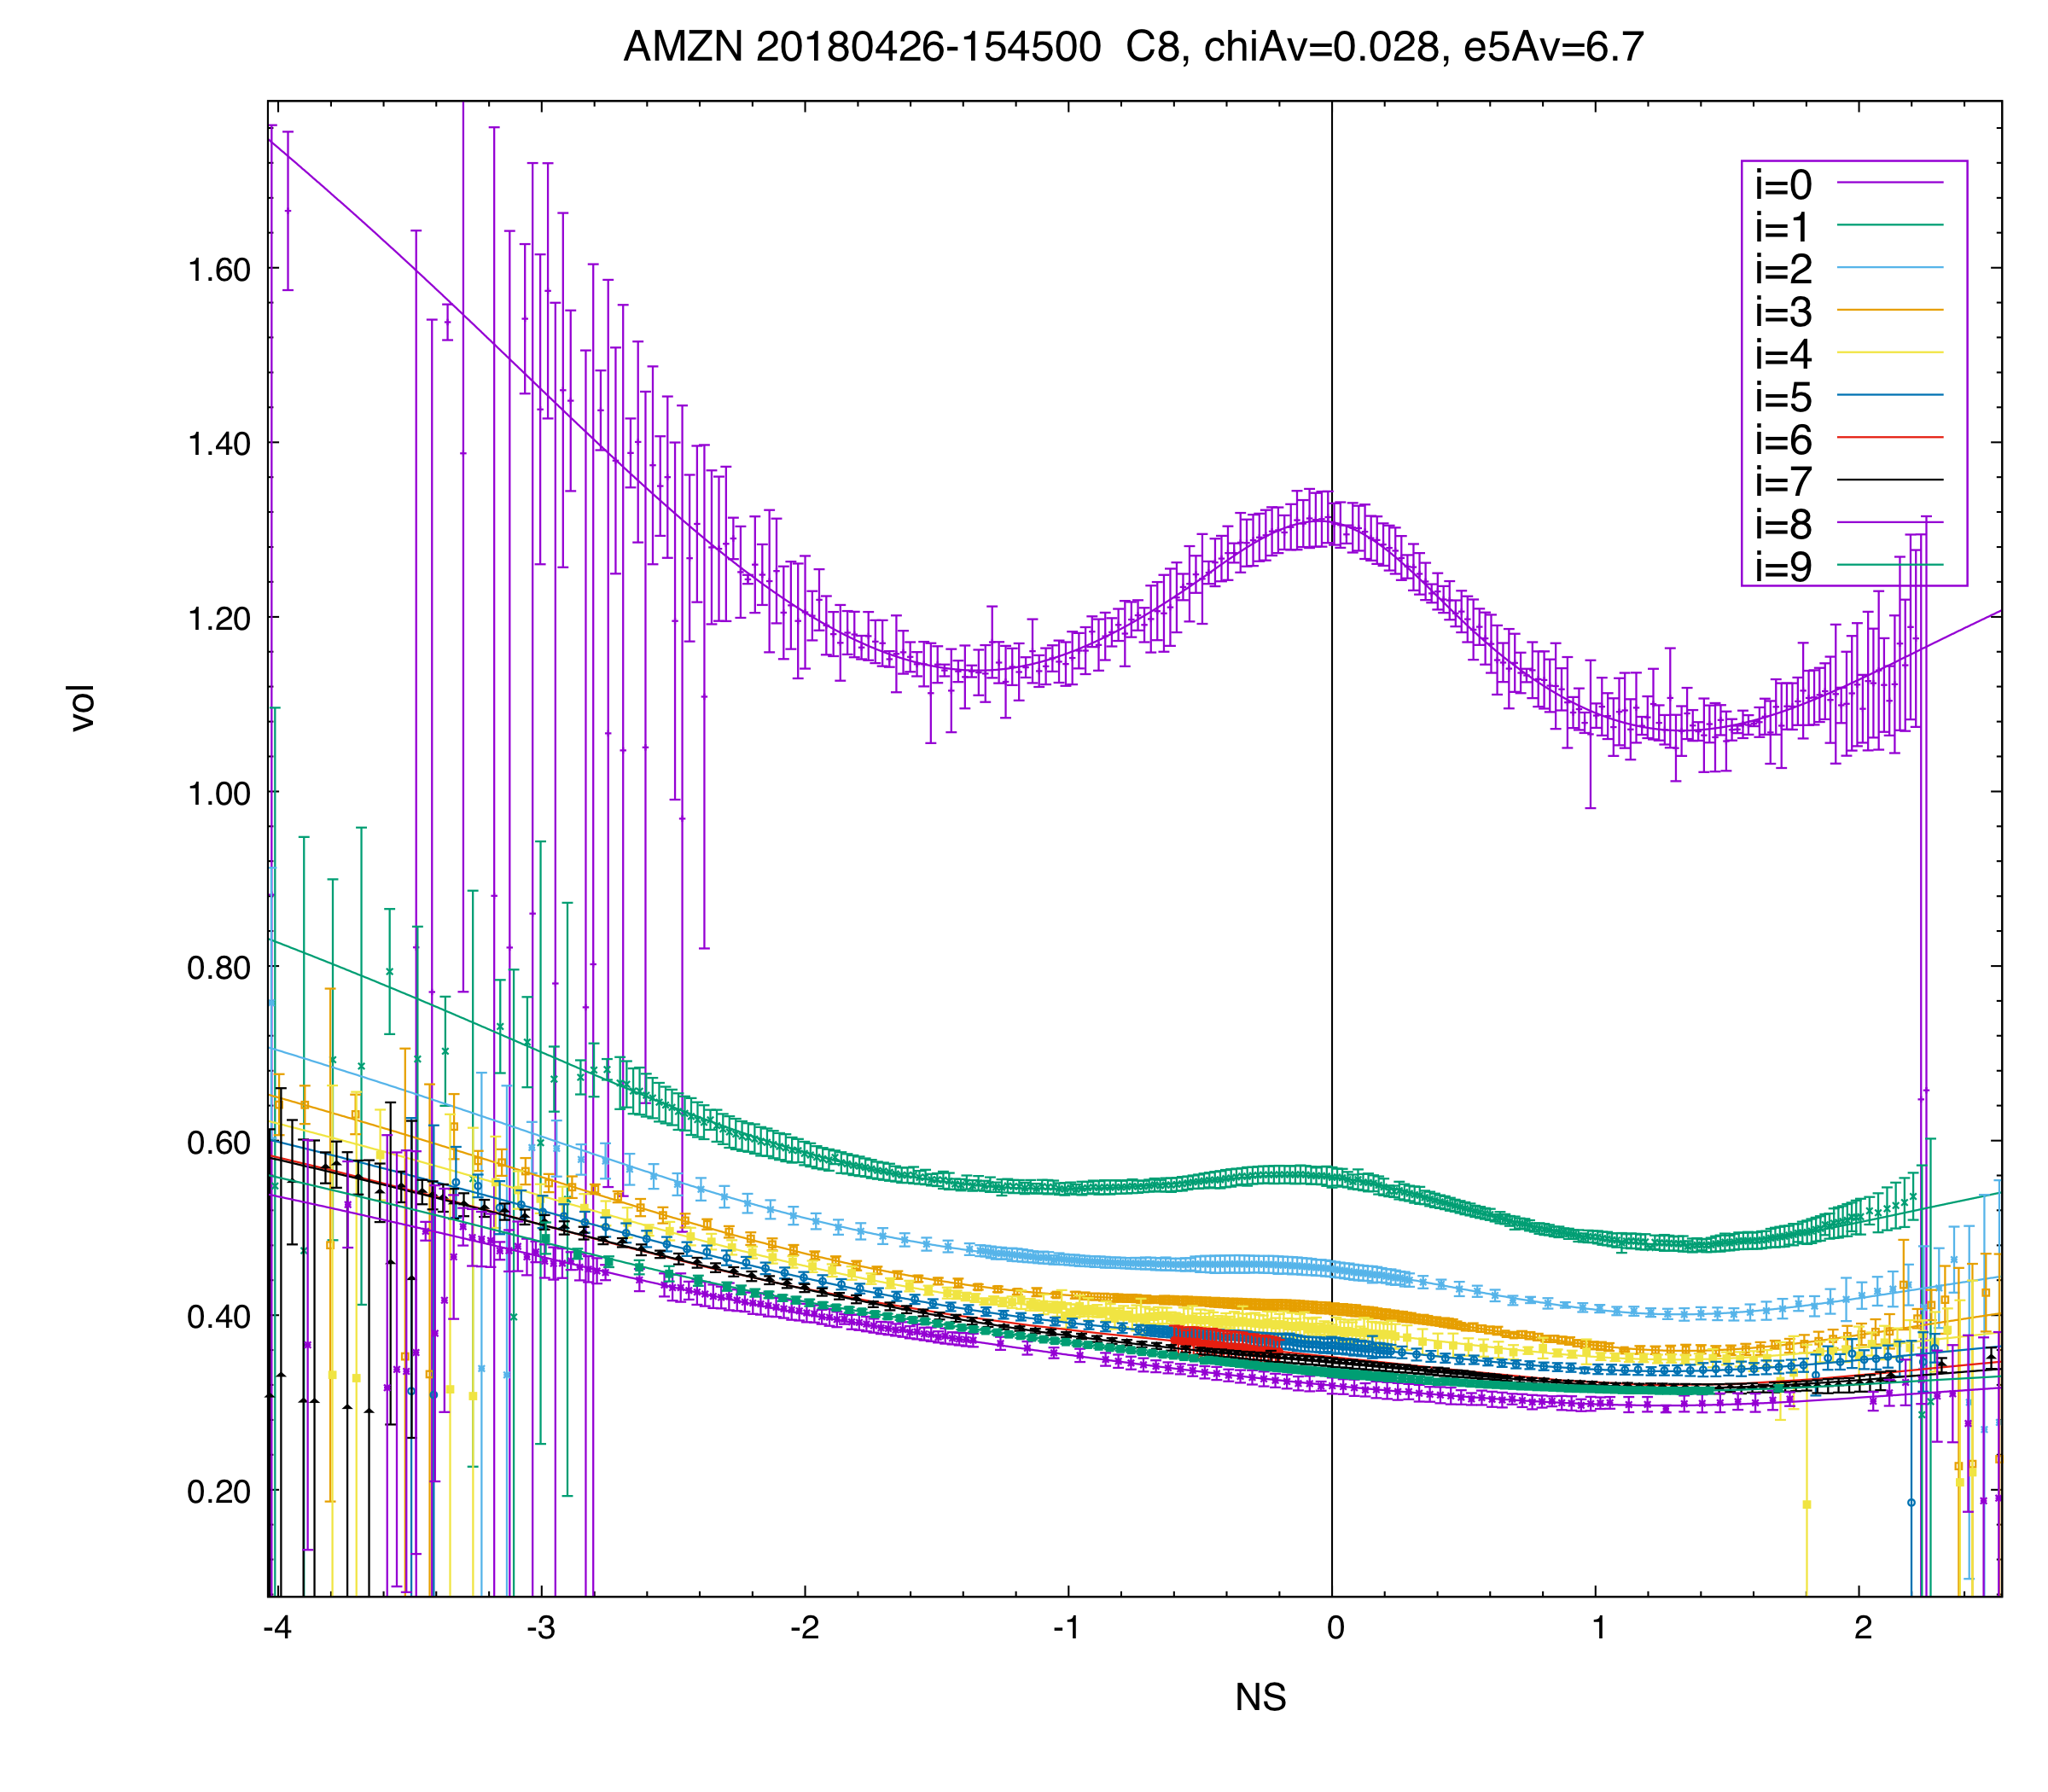
On the left, we show fitted implied vols and market implied vols as a function of normalized strike for the first 10 expiries on Thursday 2018-04-26 at 15:45 EST, just before earnings are announced after the close.
There are a lot of interesting features revealed in this surface. The first few expiries have the W-shaped vol curves characteristic of big tech names around earnings.
Note also that on this day the weekly expiring on 2018-06-08 (i=6) is first listed, with only a few strikes (and small strike range) compared to the other terms.
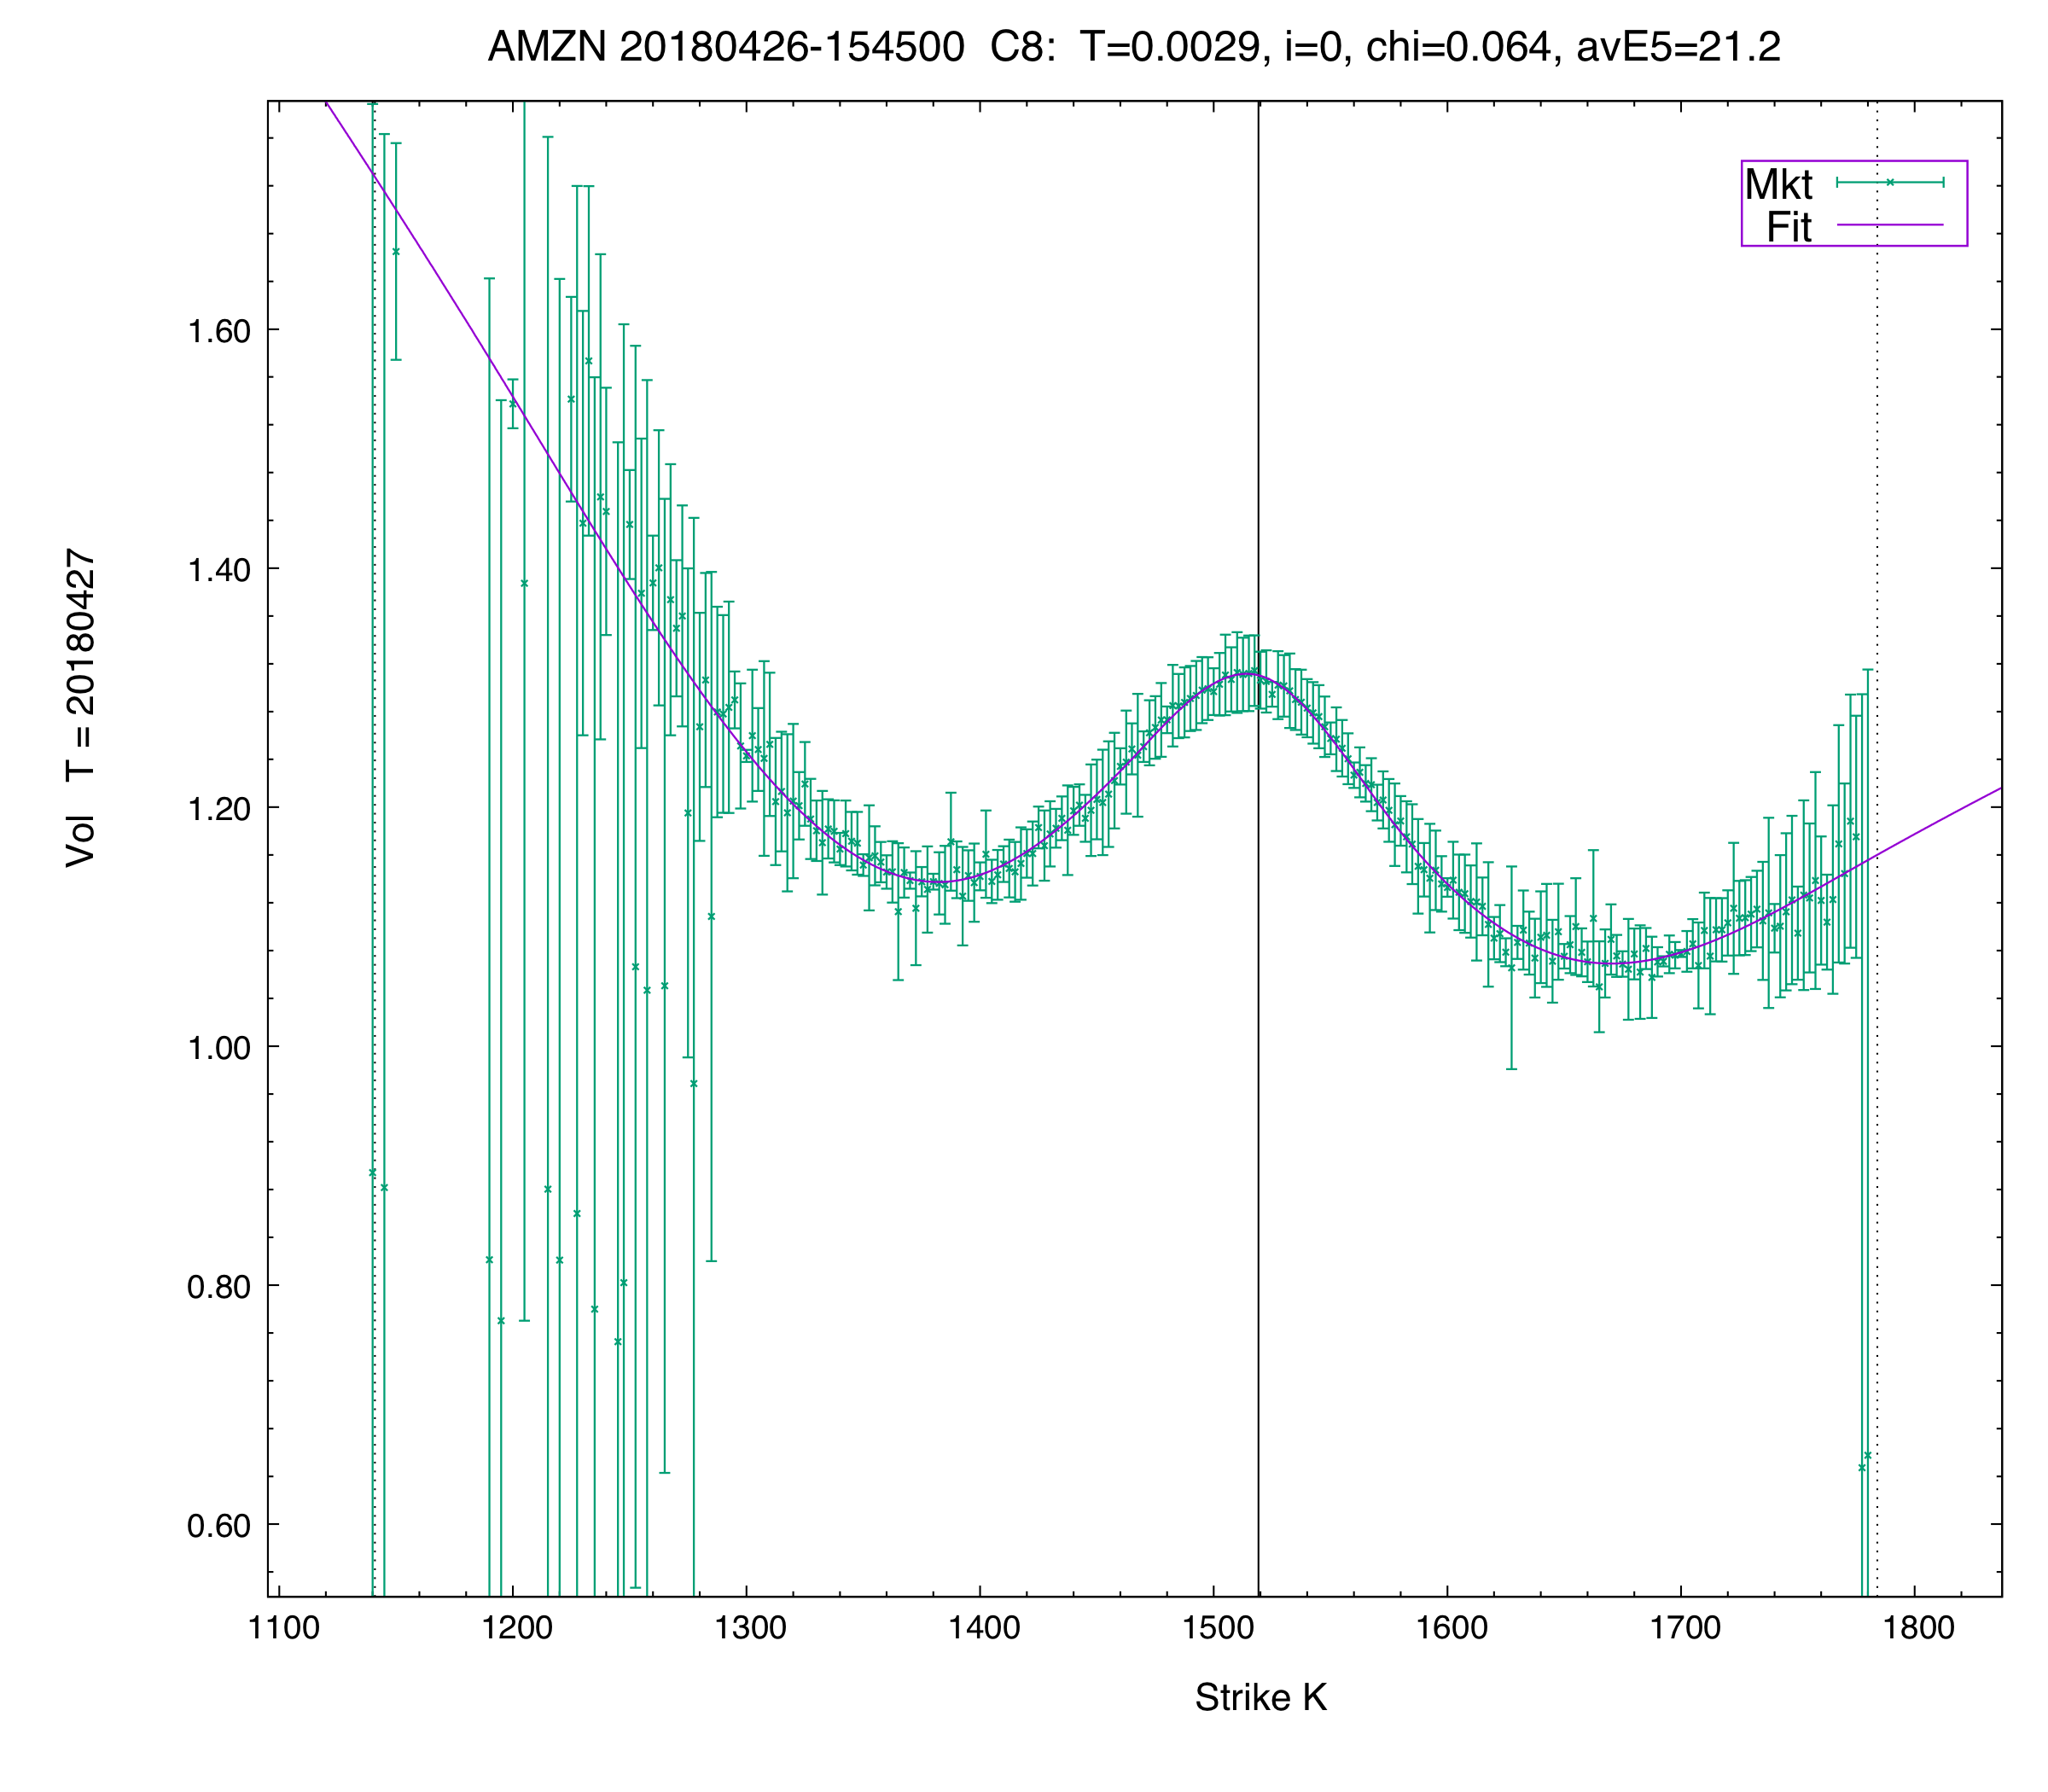
Fitted vol in K-space for the first expiry — about 1.06 days to expiry.
This fit for the first expiry has the strongest W-shape, ie the most negative ATF curvature we have ever seen!
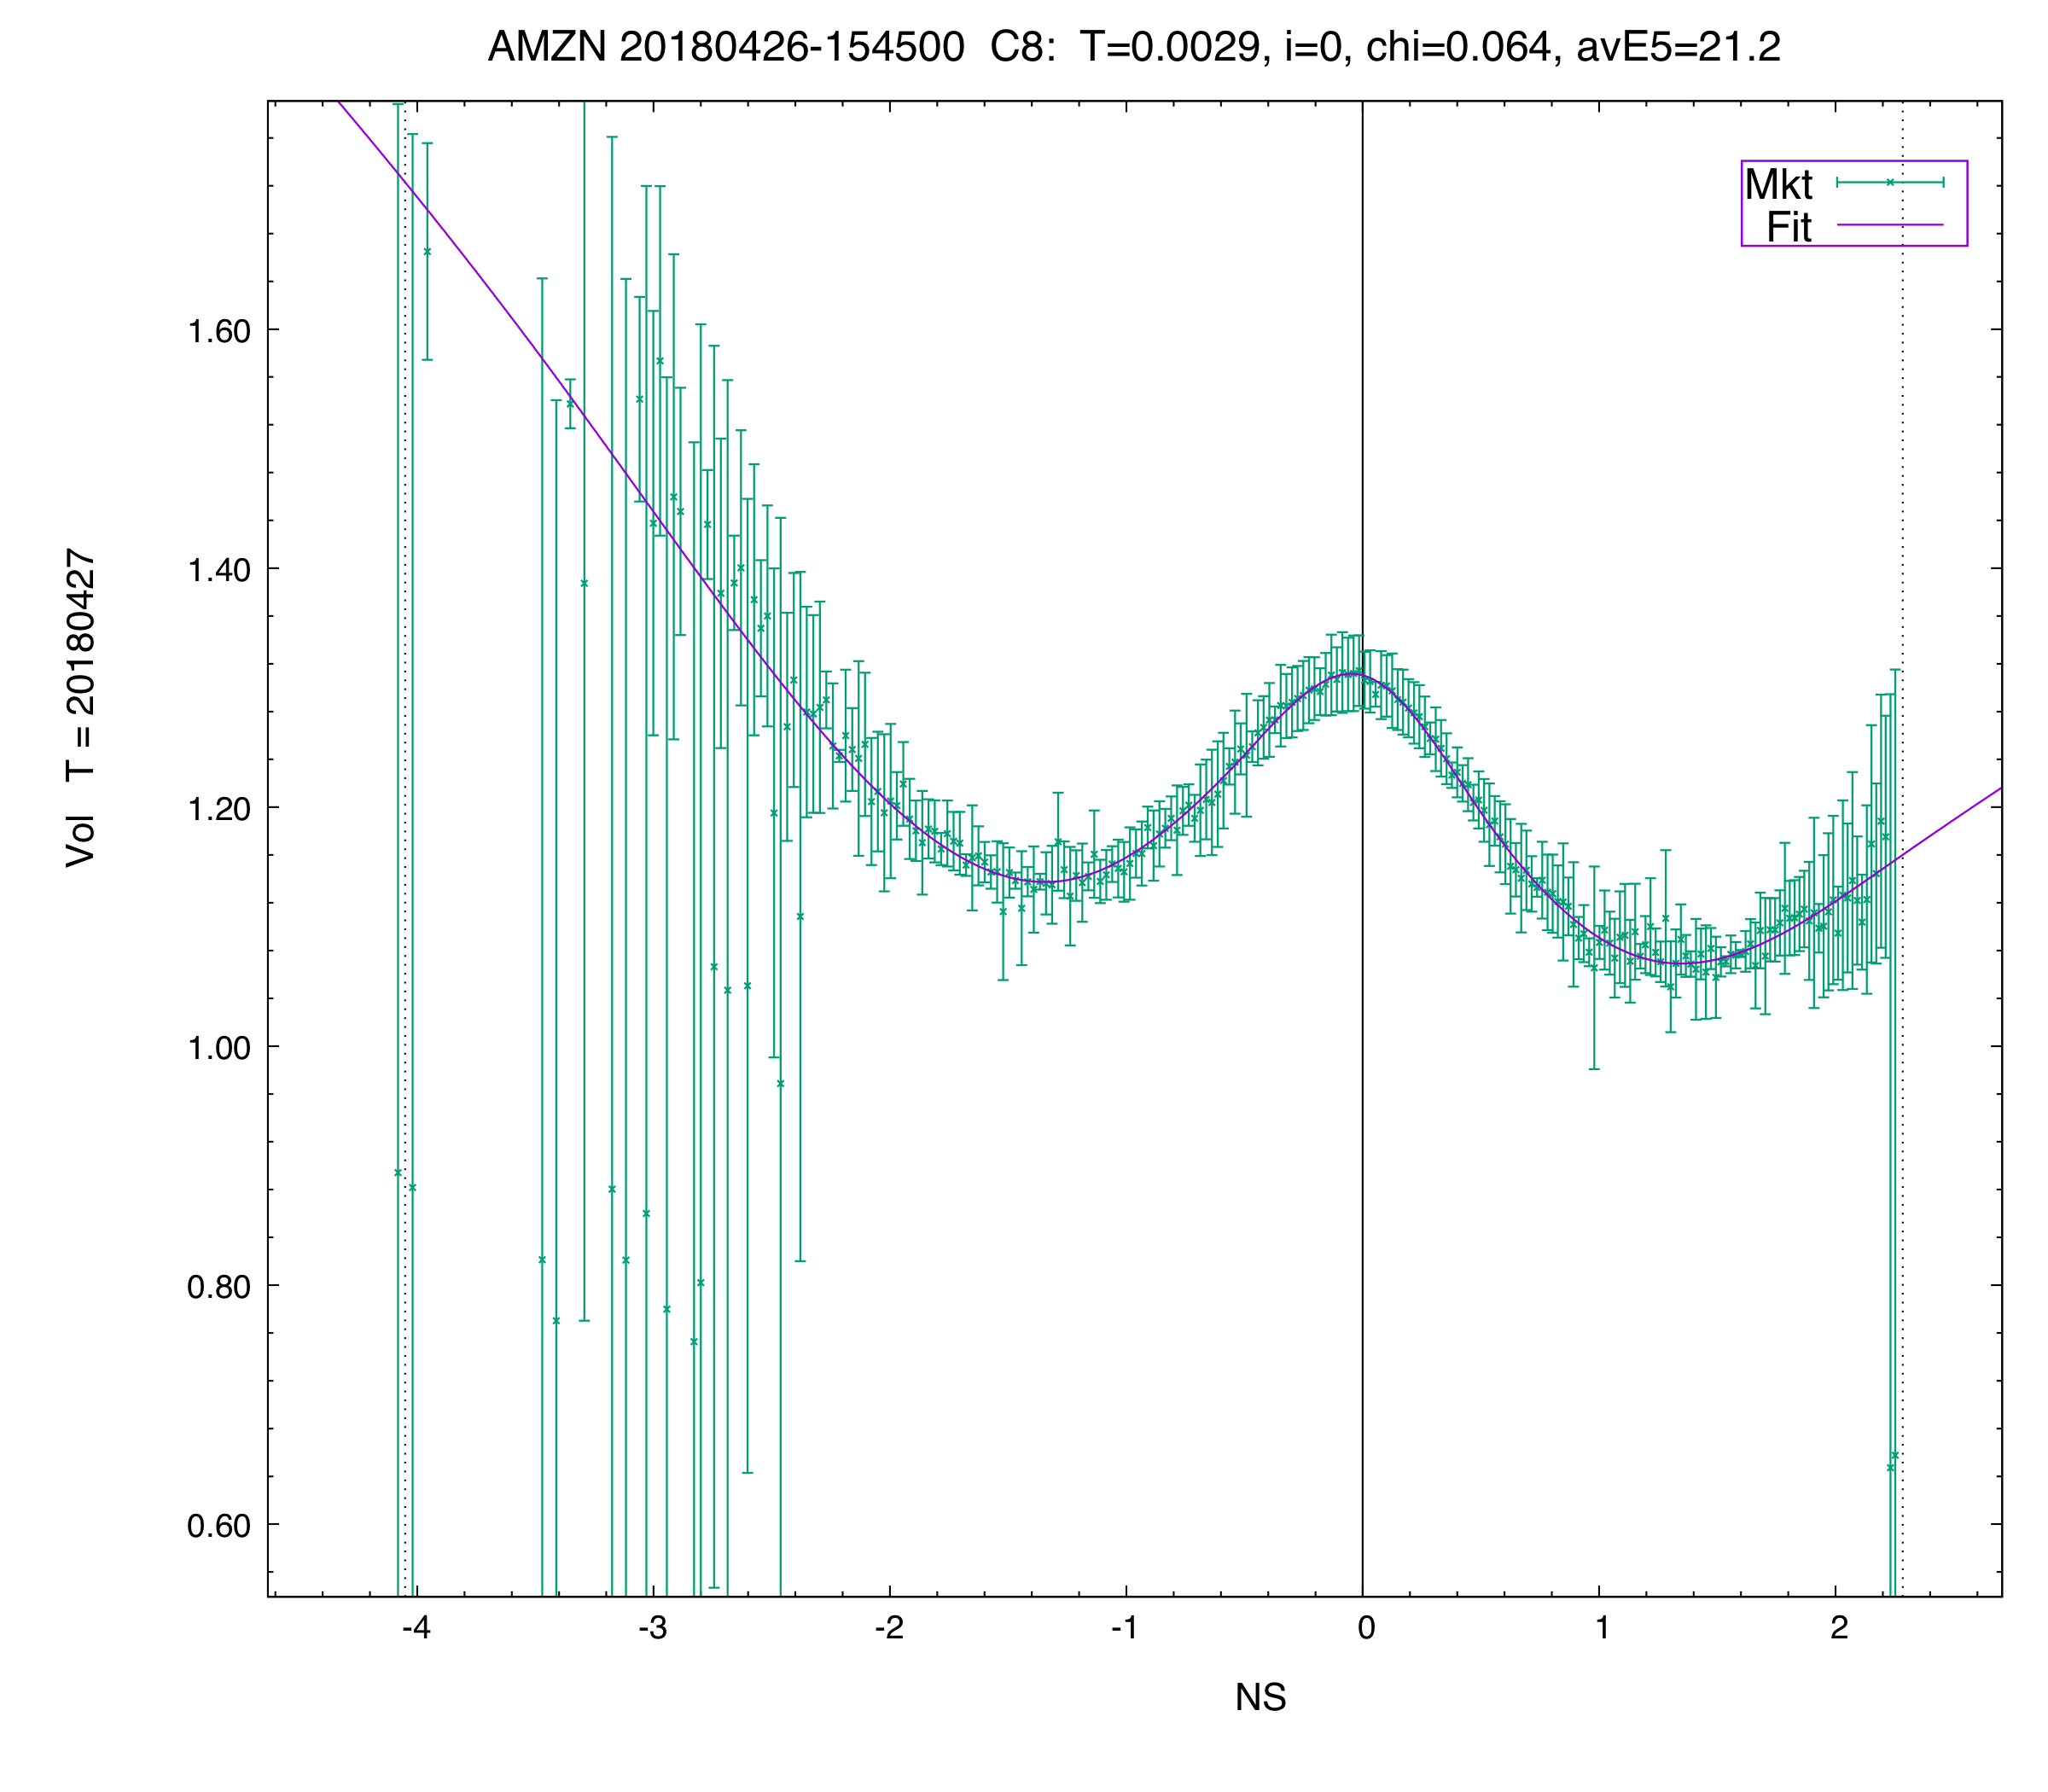
Fitted vol in NS-space for the first expiry.
Despite the negative ATF curvature (i.e. negative 'c2' parameter), this term does not have any butterfly arbitrage. In fact, the whole surface is free of butterfly and calendar arbitrage. The absence of calendar arb is illustrated in the next two plots.
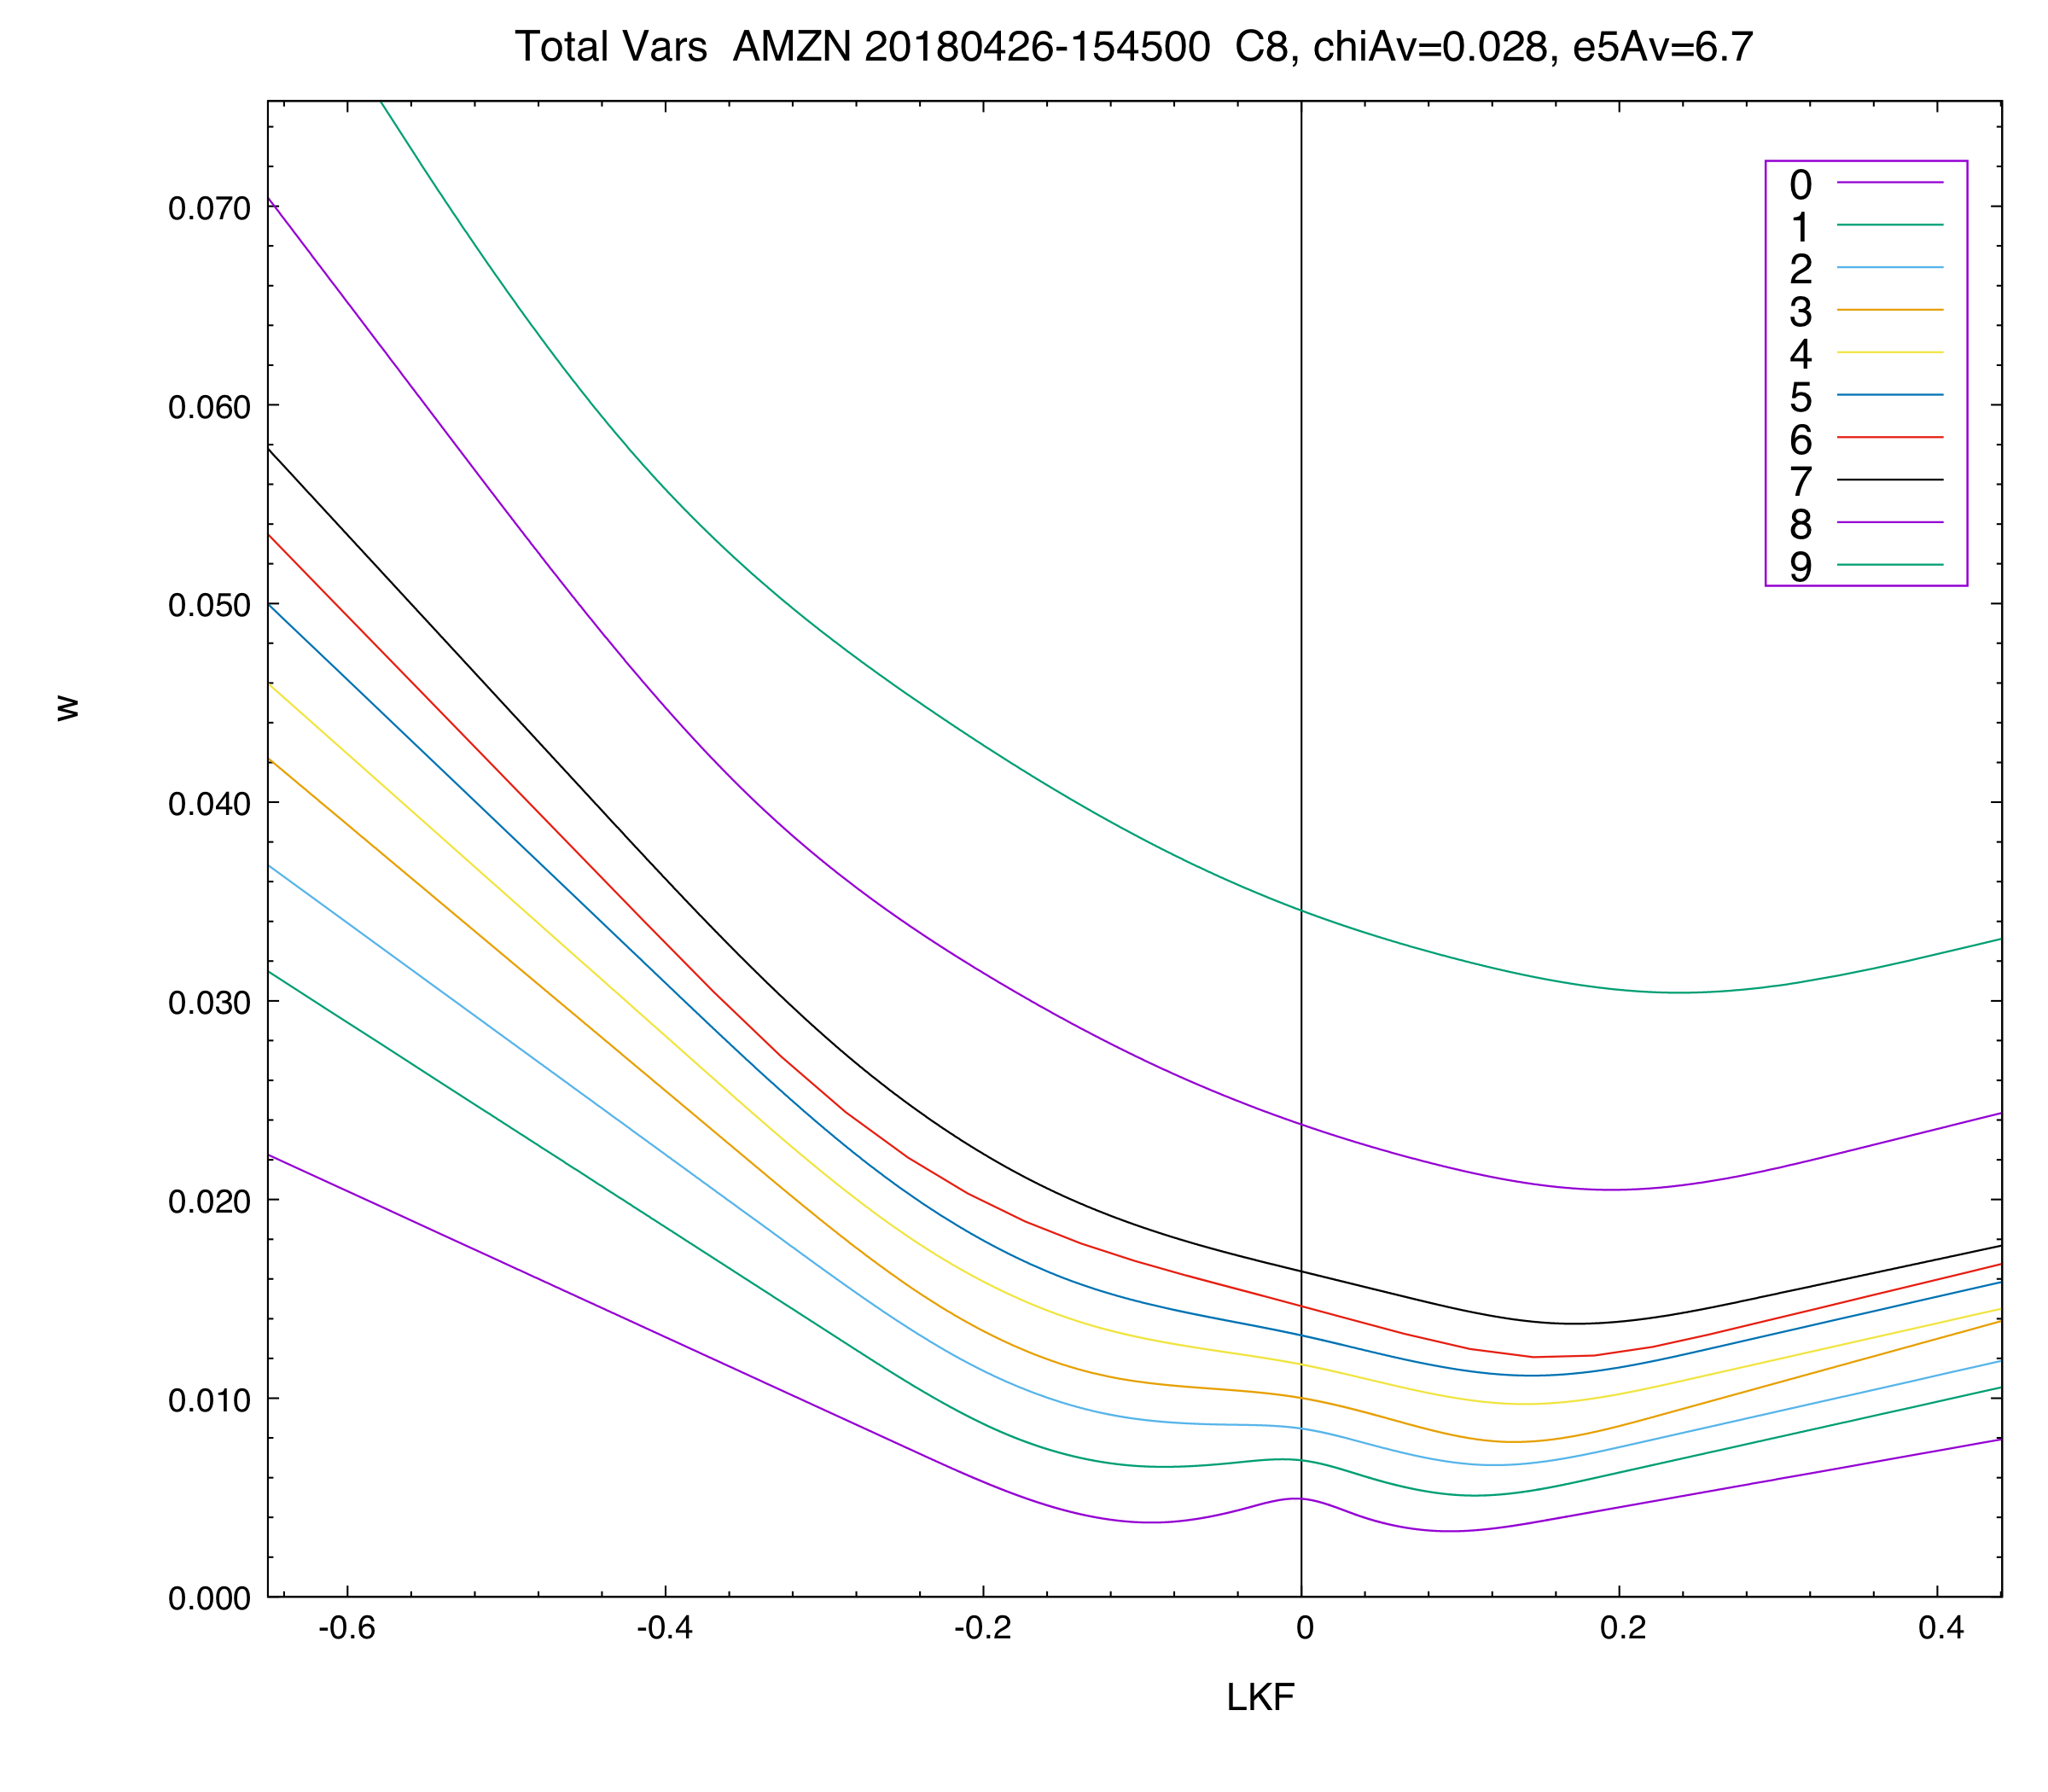
Total variance as function of log-moneyness, log(K/F), for the first 10 terms (the rest are "boring" and would just overcrowd the plot).
The fact that the lines don’t intersect (and are in order by expiry) proves that there is no calendar arbitrage.
Note that here we plot the vols of the first 10 terms across (the same) wide range of strikes, by sampling the appropriate vol curves, rather than at the strikes listed for each term (which is often a much smaller range, especially for the i=6 term).
The first 8 maturities are spaced 7 days apart, from Friday April 27, 2018 (1 day) to Friday June 15, 2018 (50 days).
The i=8 curve corresponds to Friday July 20, 2018 (85 days) and the i=9 curve corresponds to Friday, August 17, 2018 (113 days).
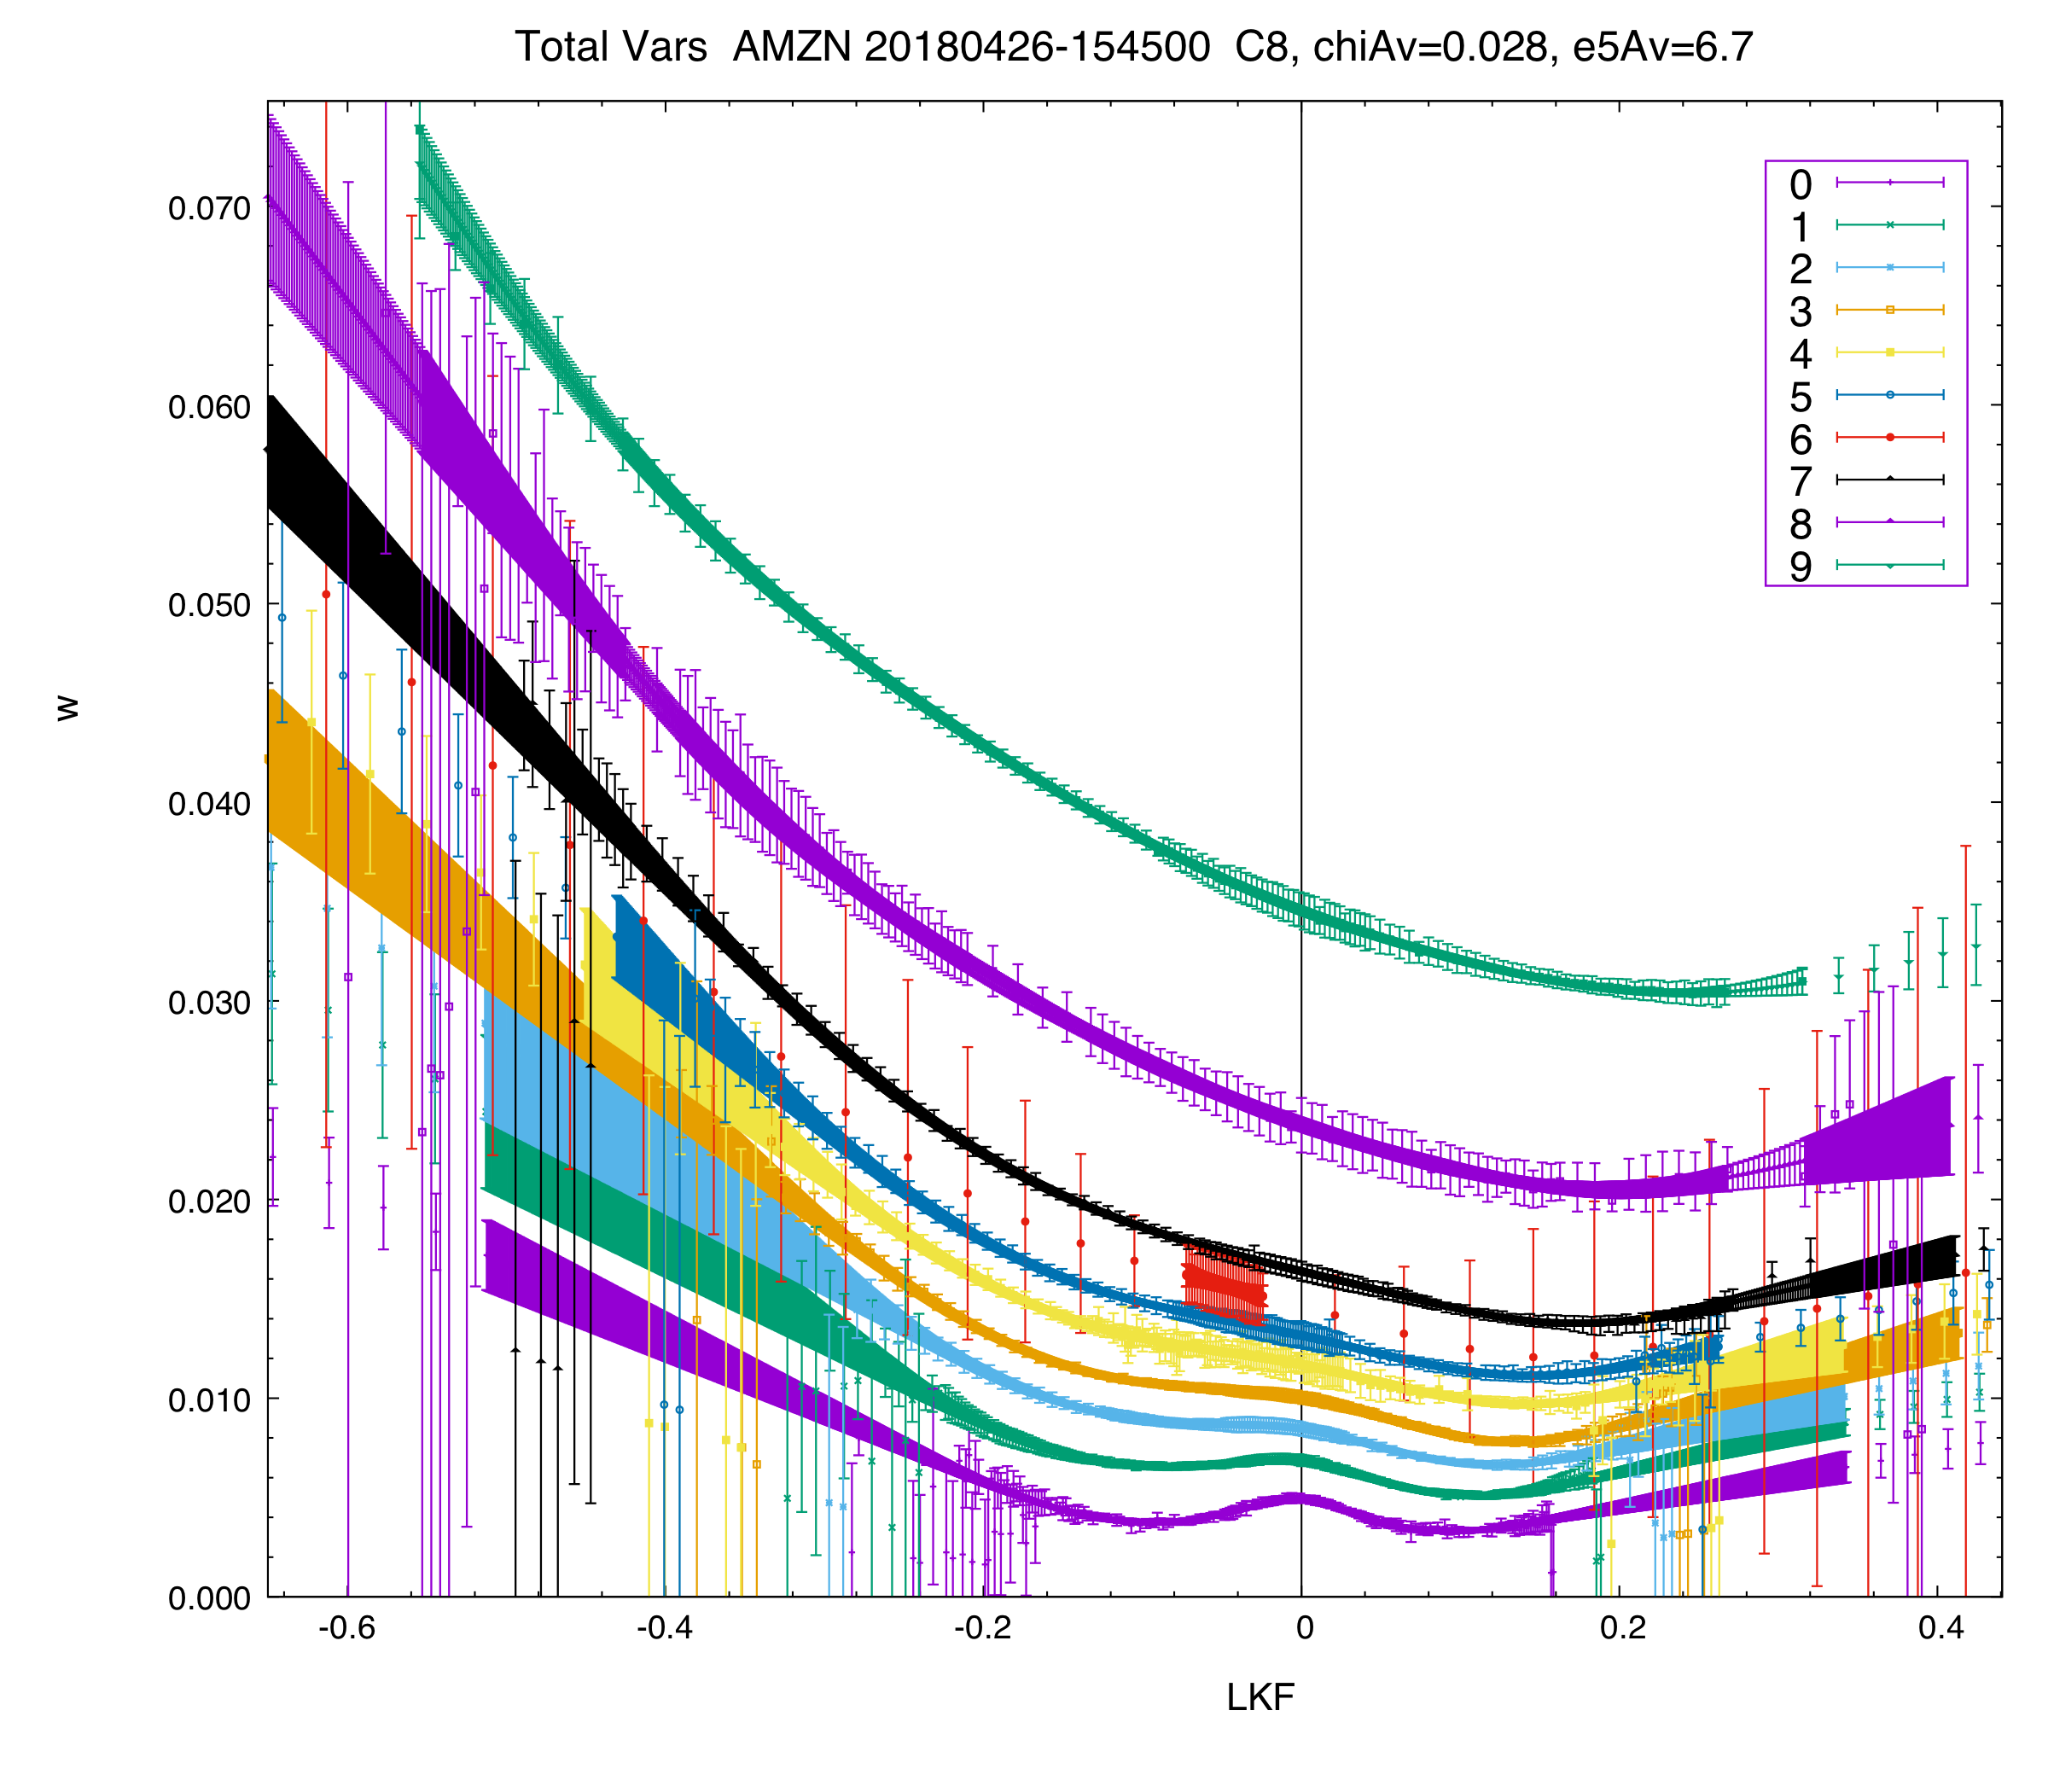
The same plot, with error bars. Similar remarks as for the AEX plots apply.
Note also the new weekly (i=6): the listed strikes only cover a small range on this day, but our vol surface properly extends the vols from this range into the wings without calendar arb (easier to see in the previous plot).
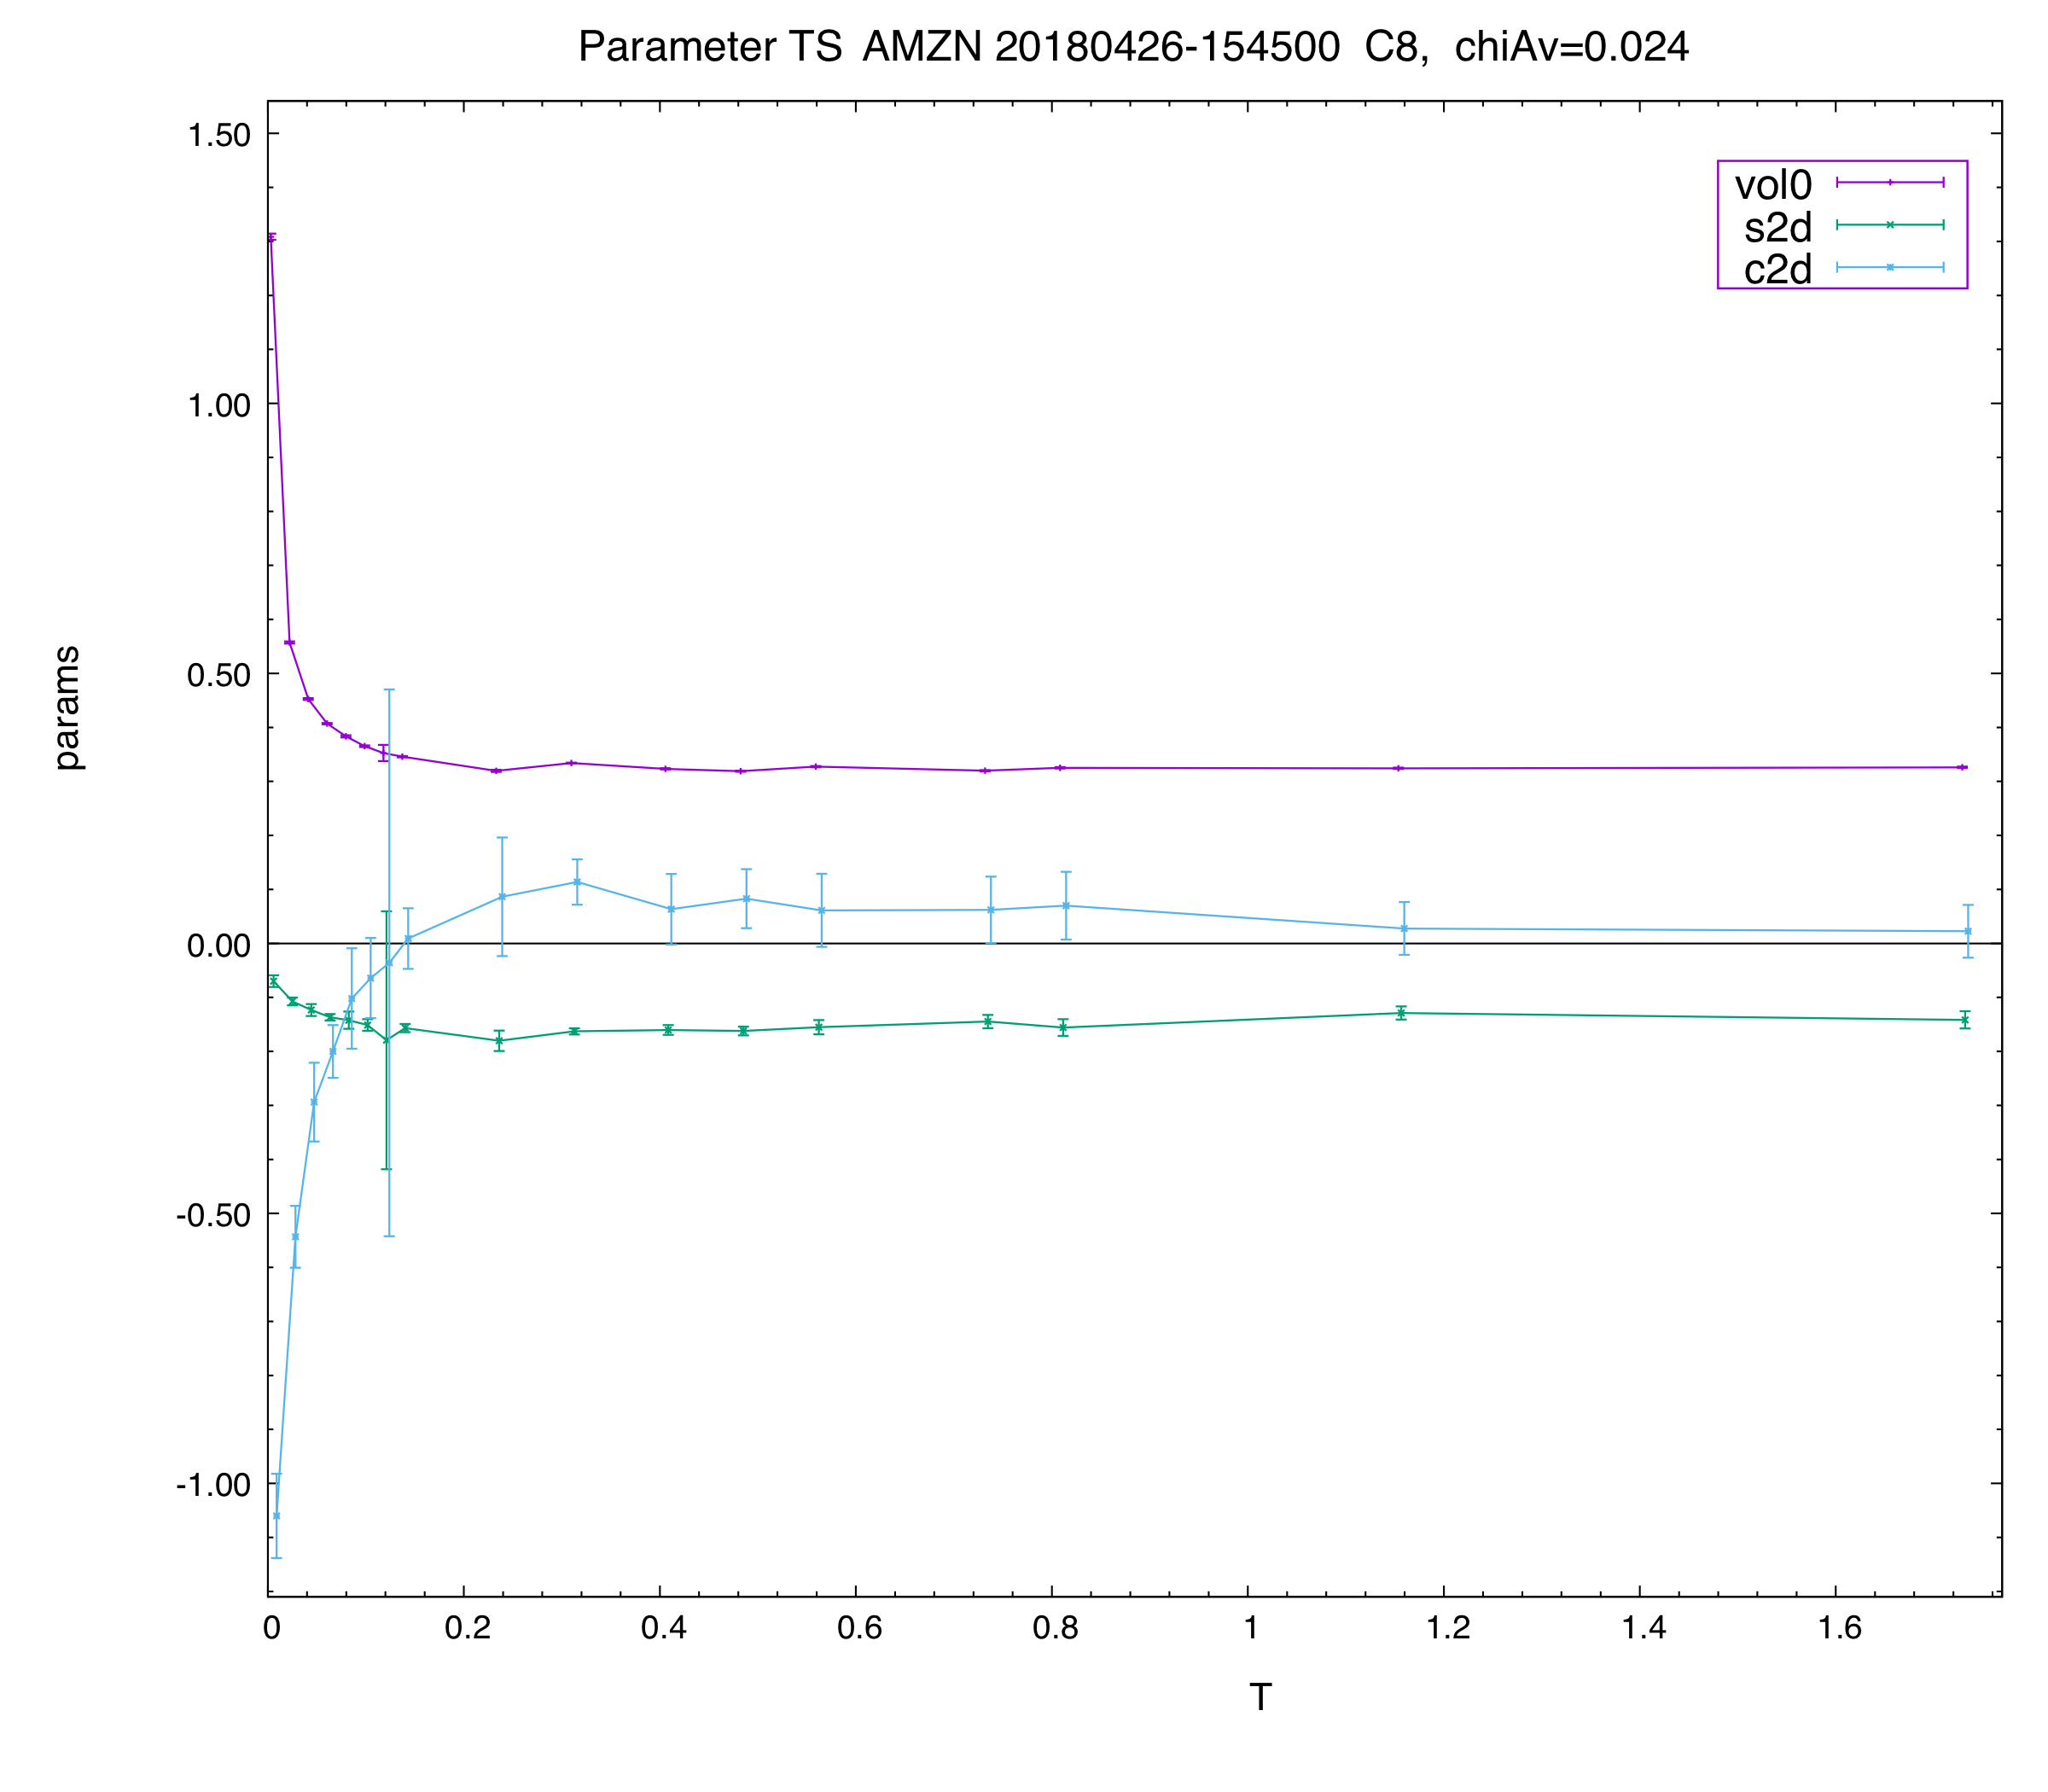
The next two plots illustrate the 3-parameter term-structure across all 17 listed terms (the x-axis is time-to-expiry in years). In the first plot we show only the first three parameters.
Note how c2 starts as low as about -1.1. But after 3-4 months the term-structure of all (shape) parameters is essentially flat.
Note the large error bars for s2, c2 for the i=6 term: This term has essentially only information about the ATM vol.
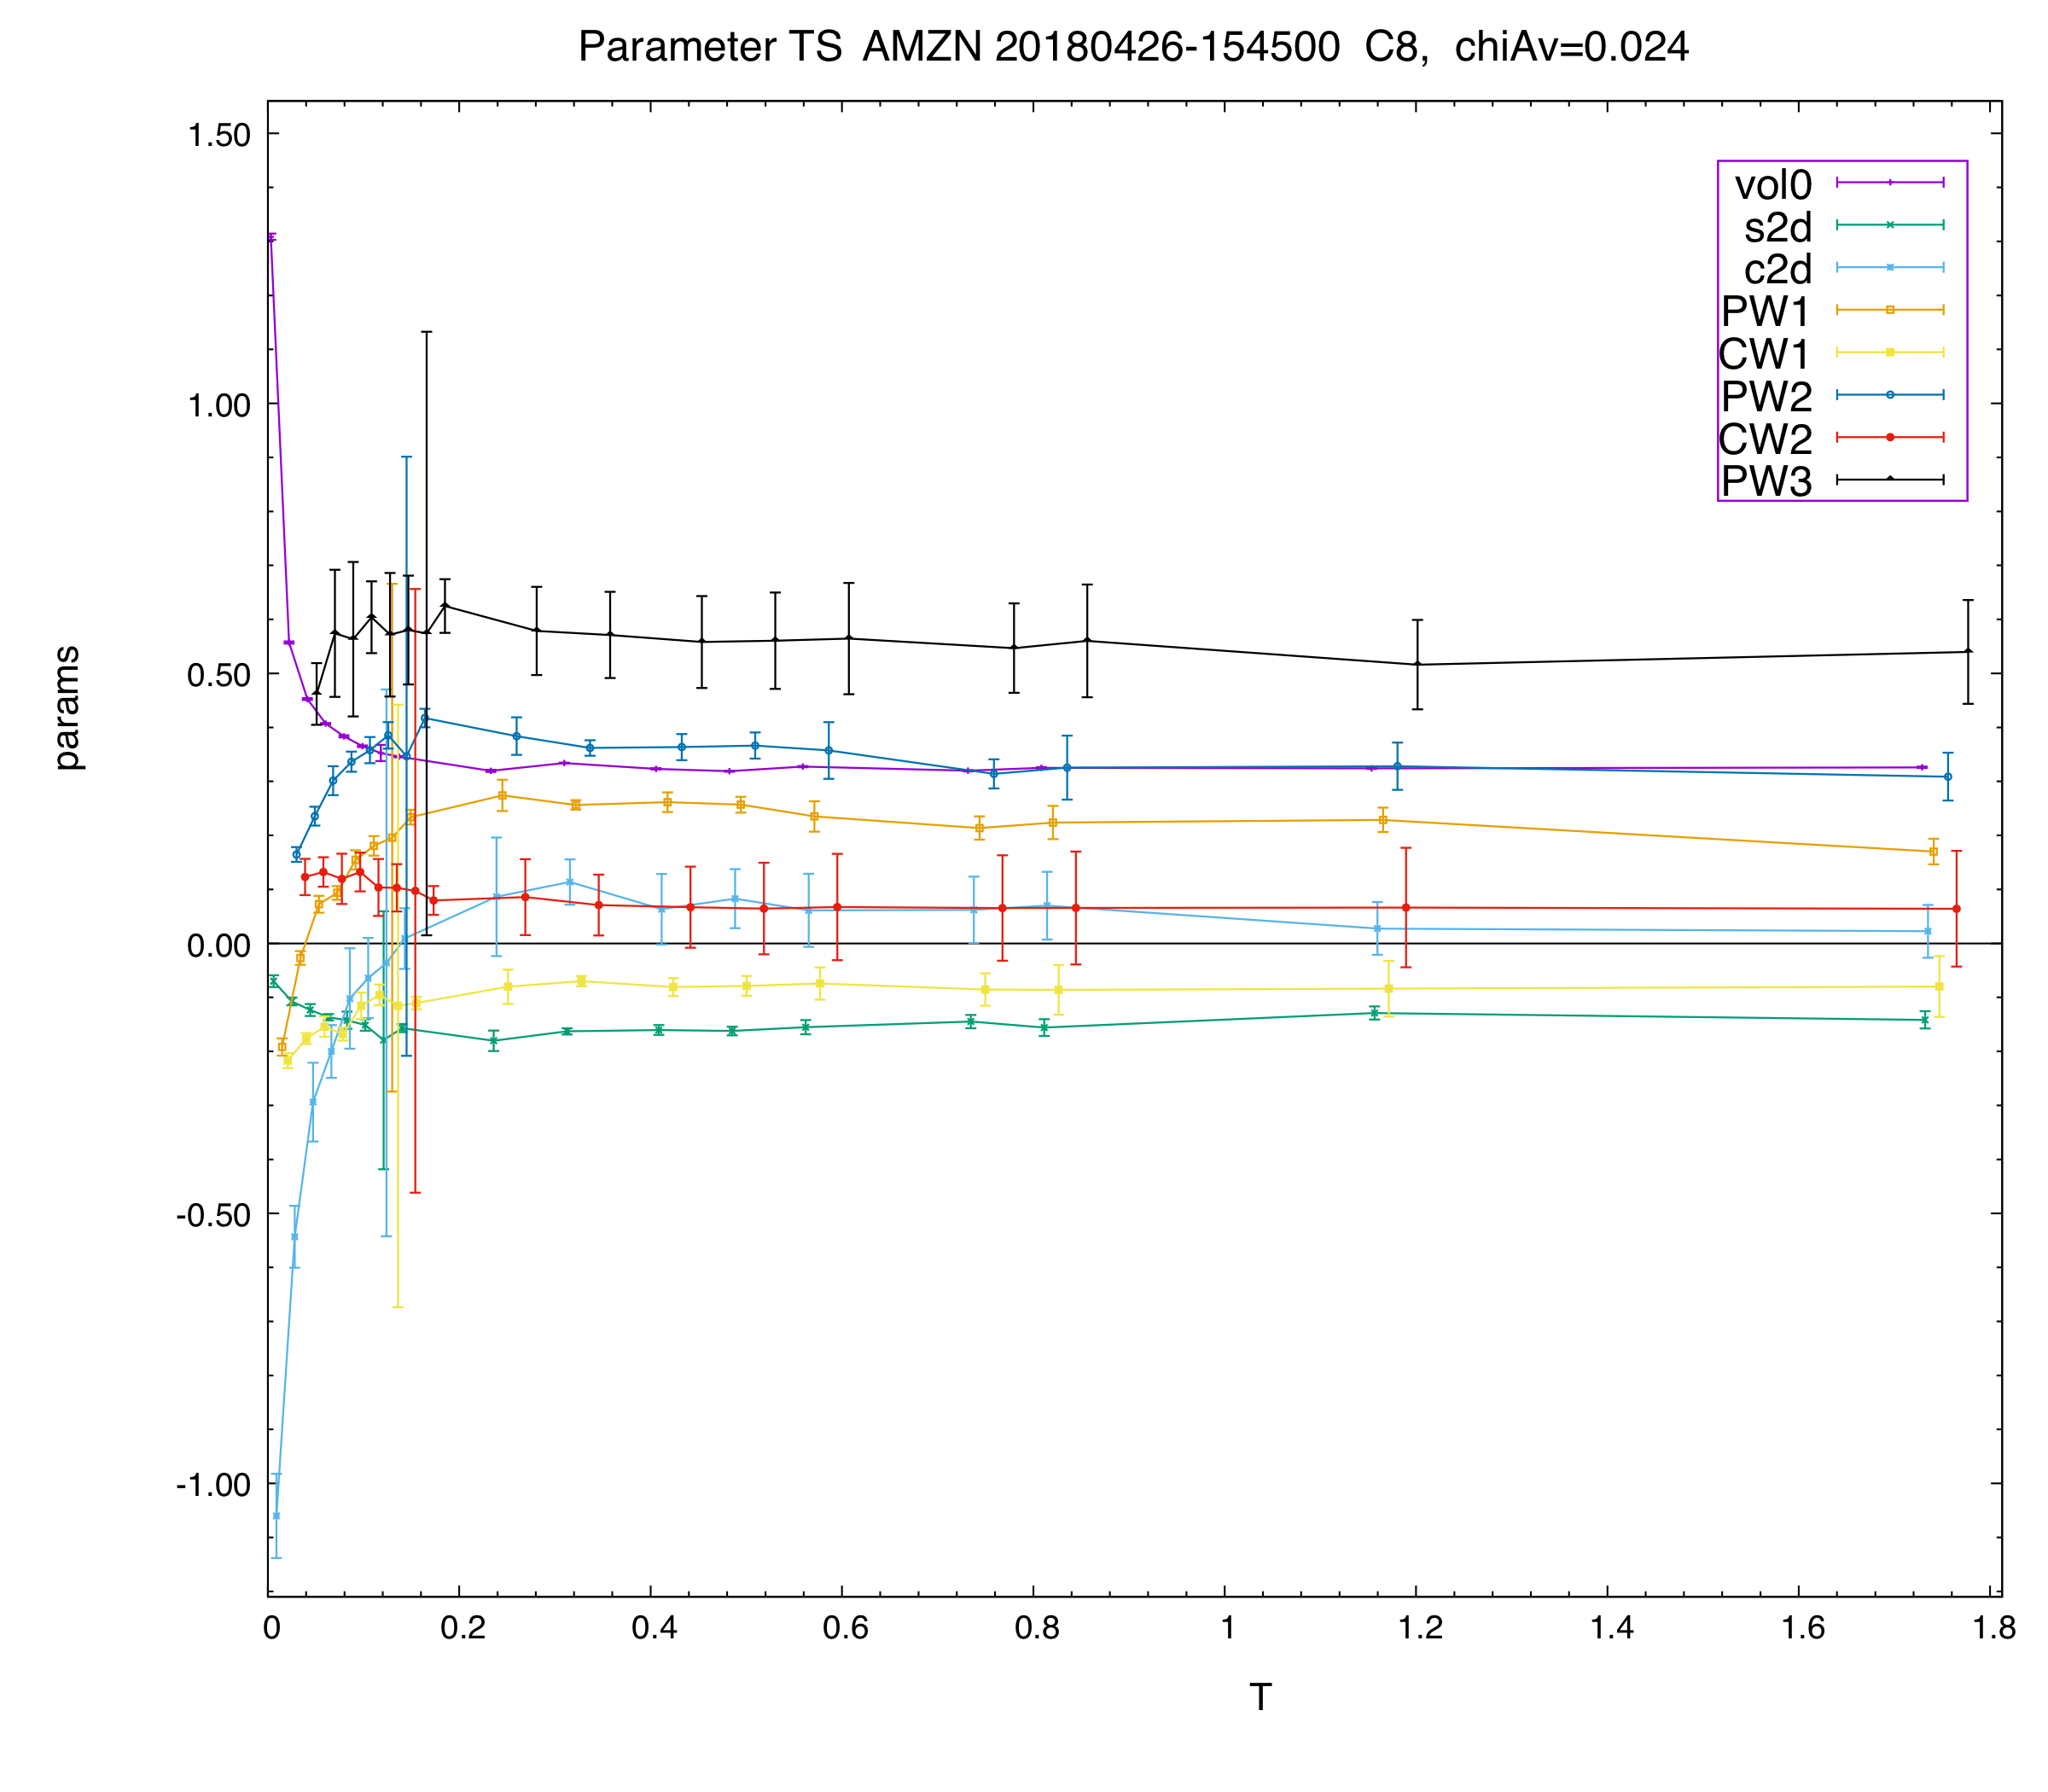
Here we show the term-structure of all 8 parameters. Again, the term-structure of all (shape) parameters is flat after 3-4 months.
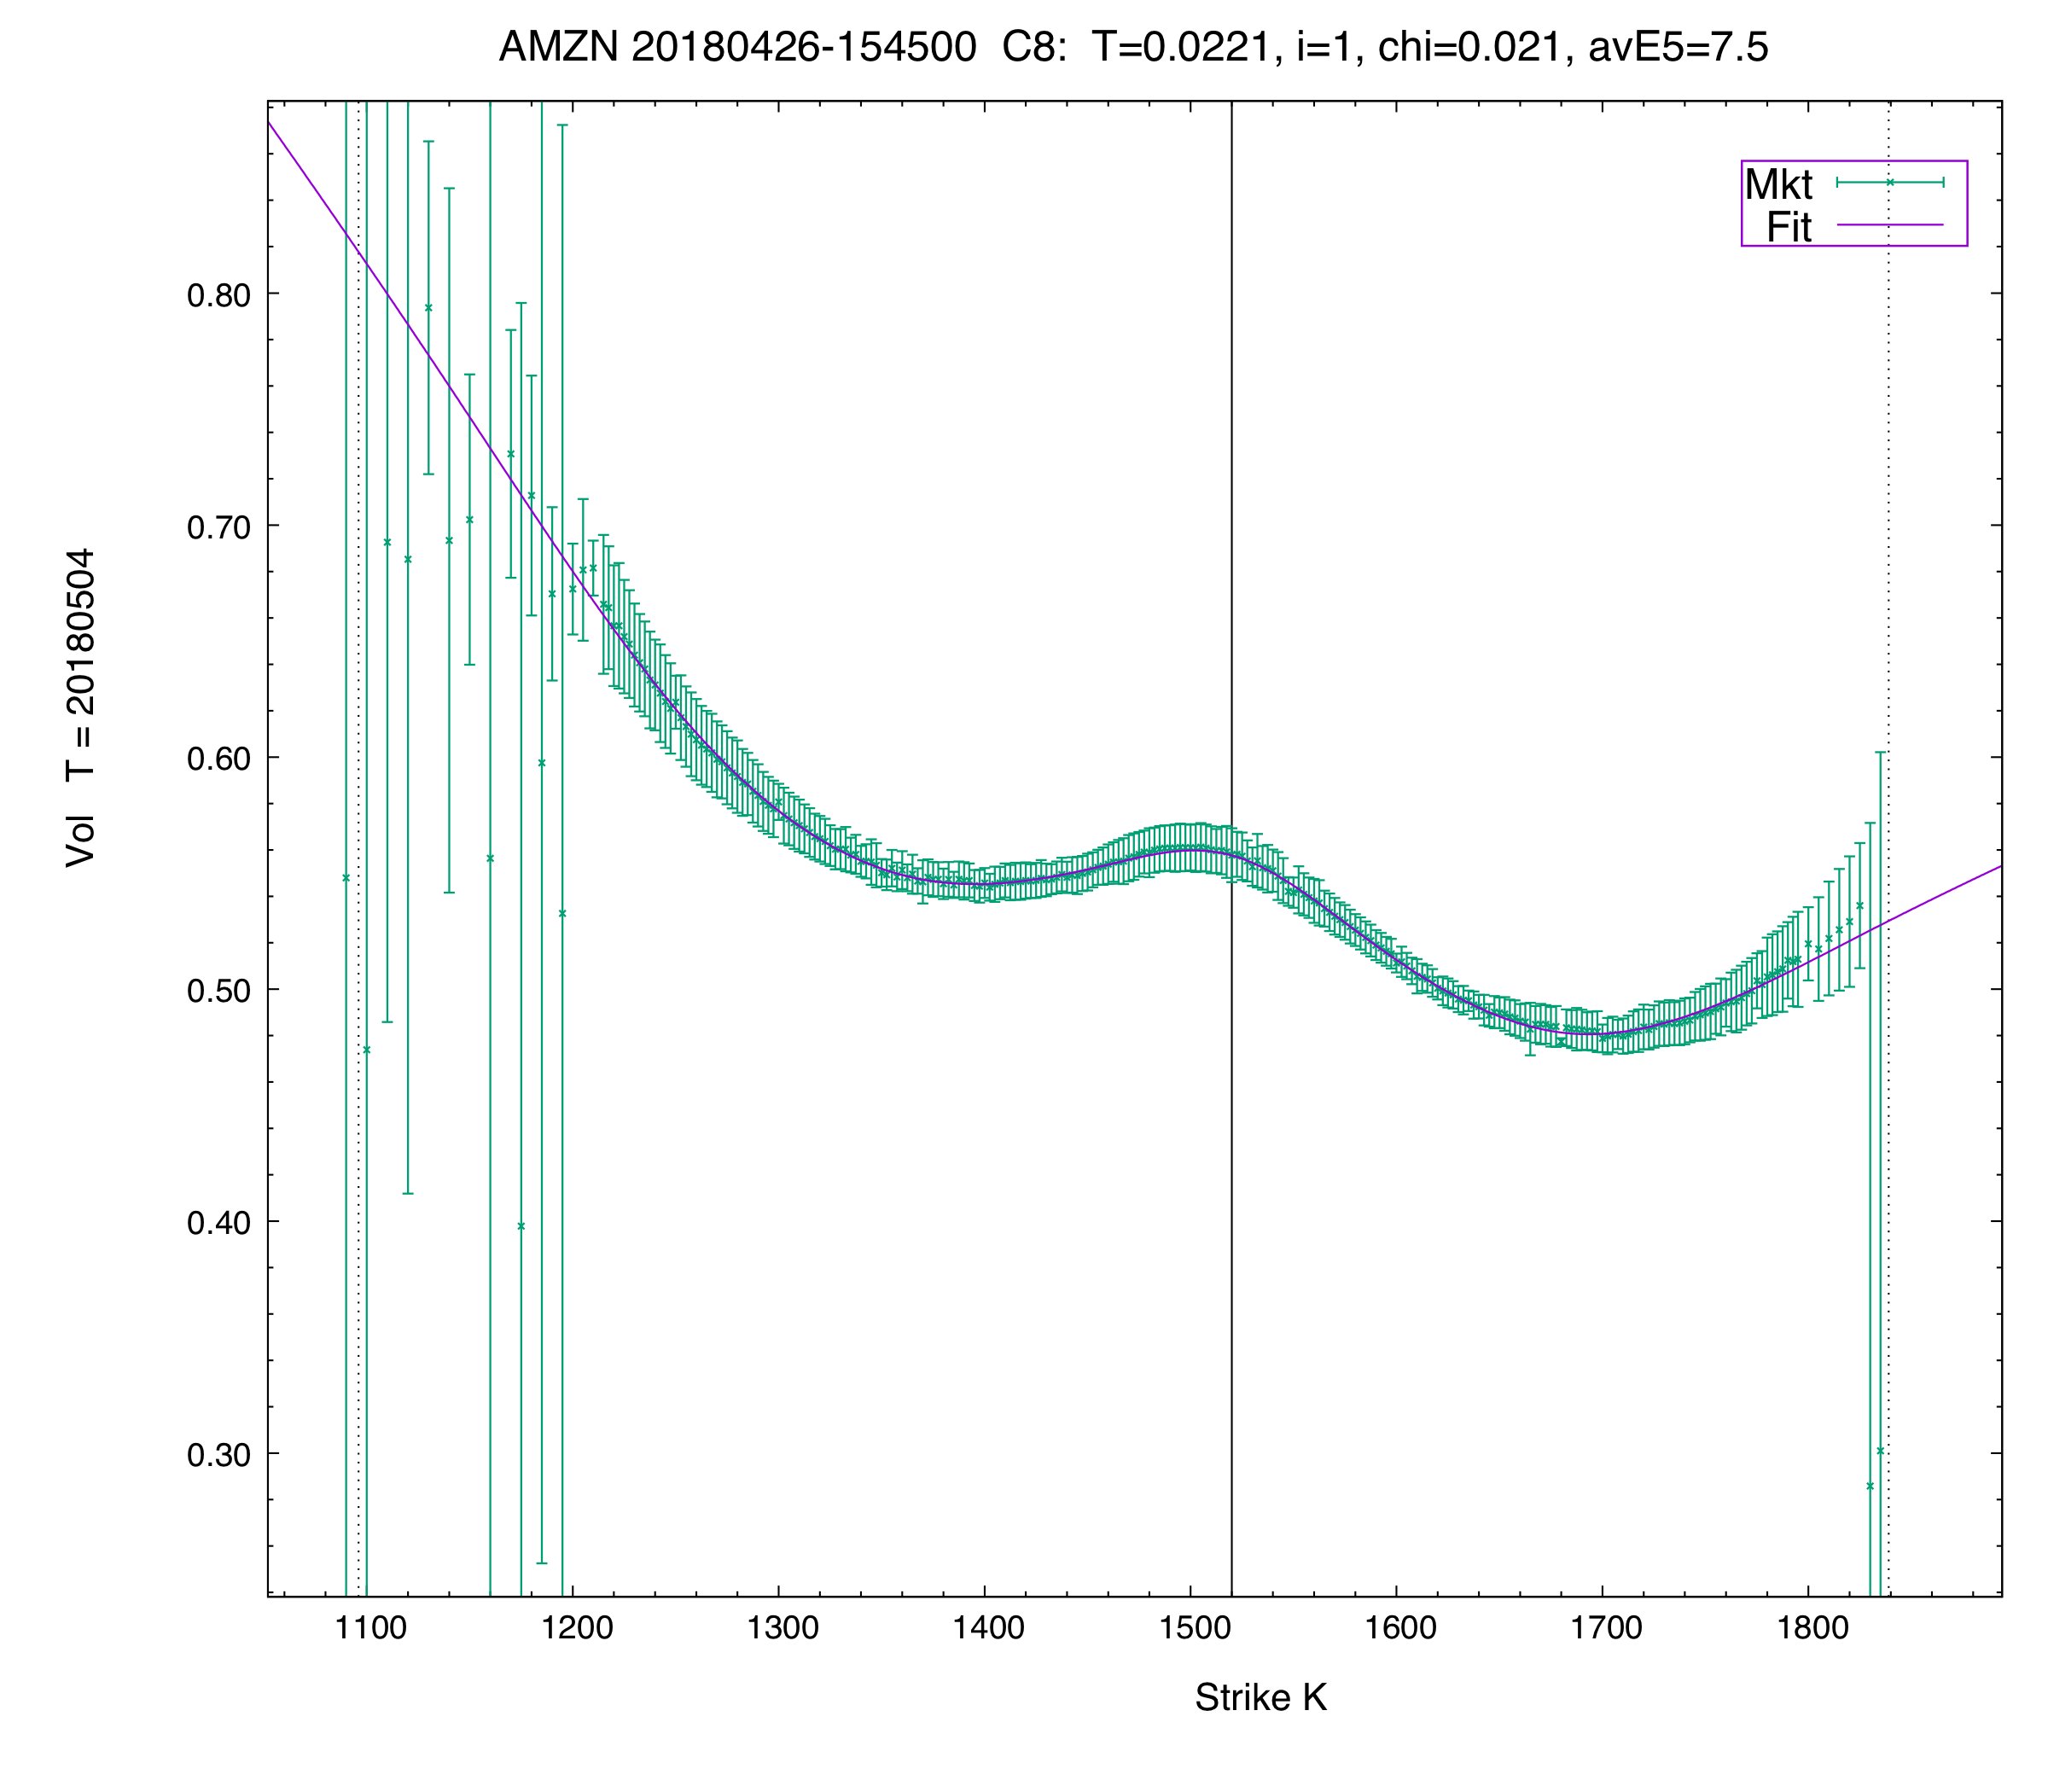
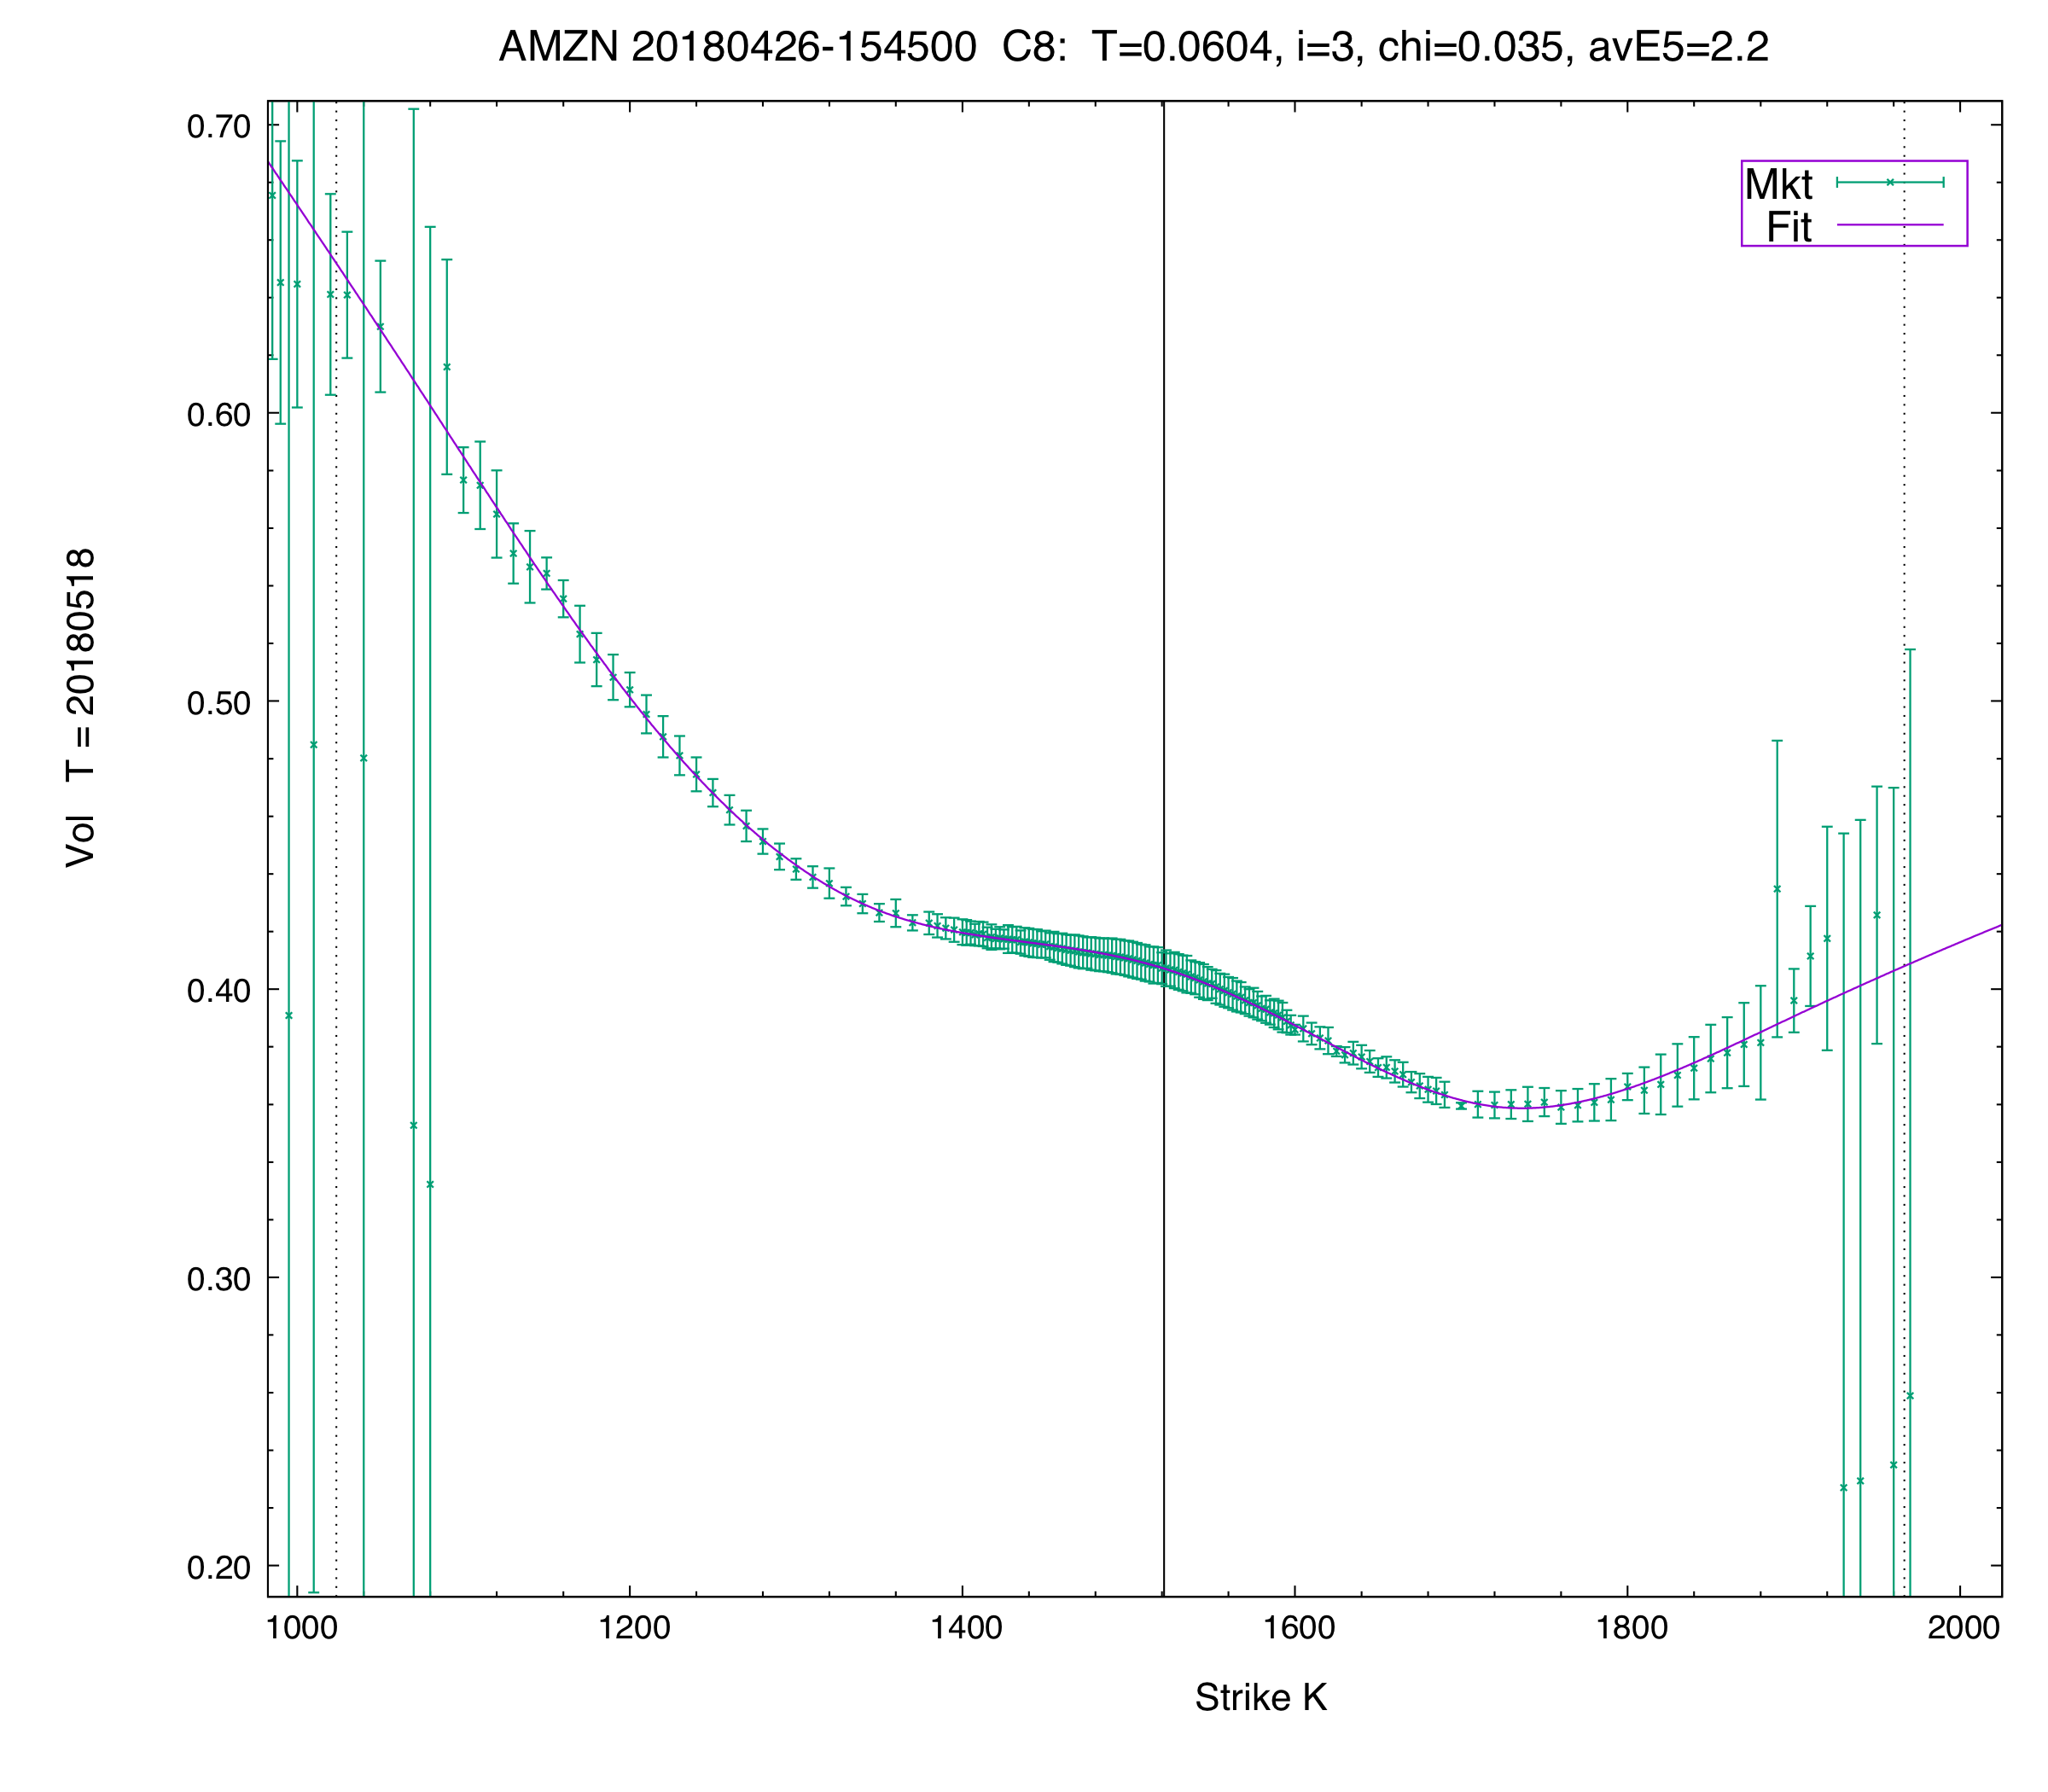
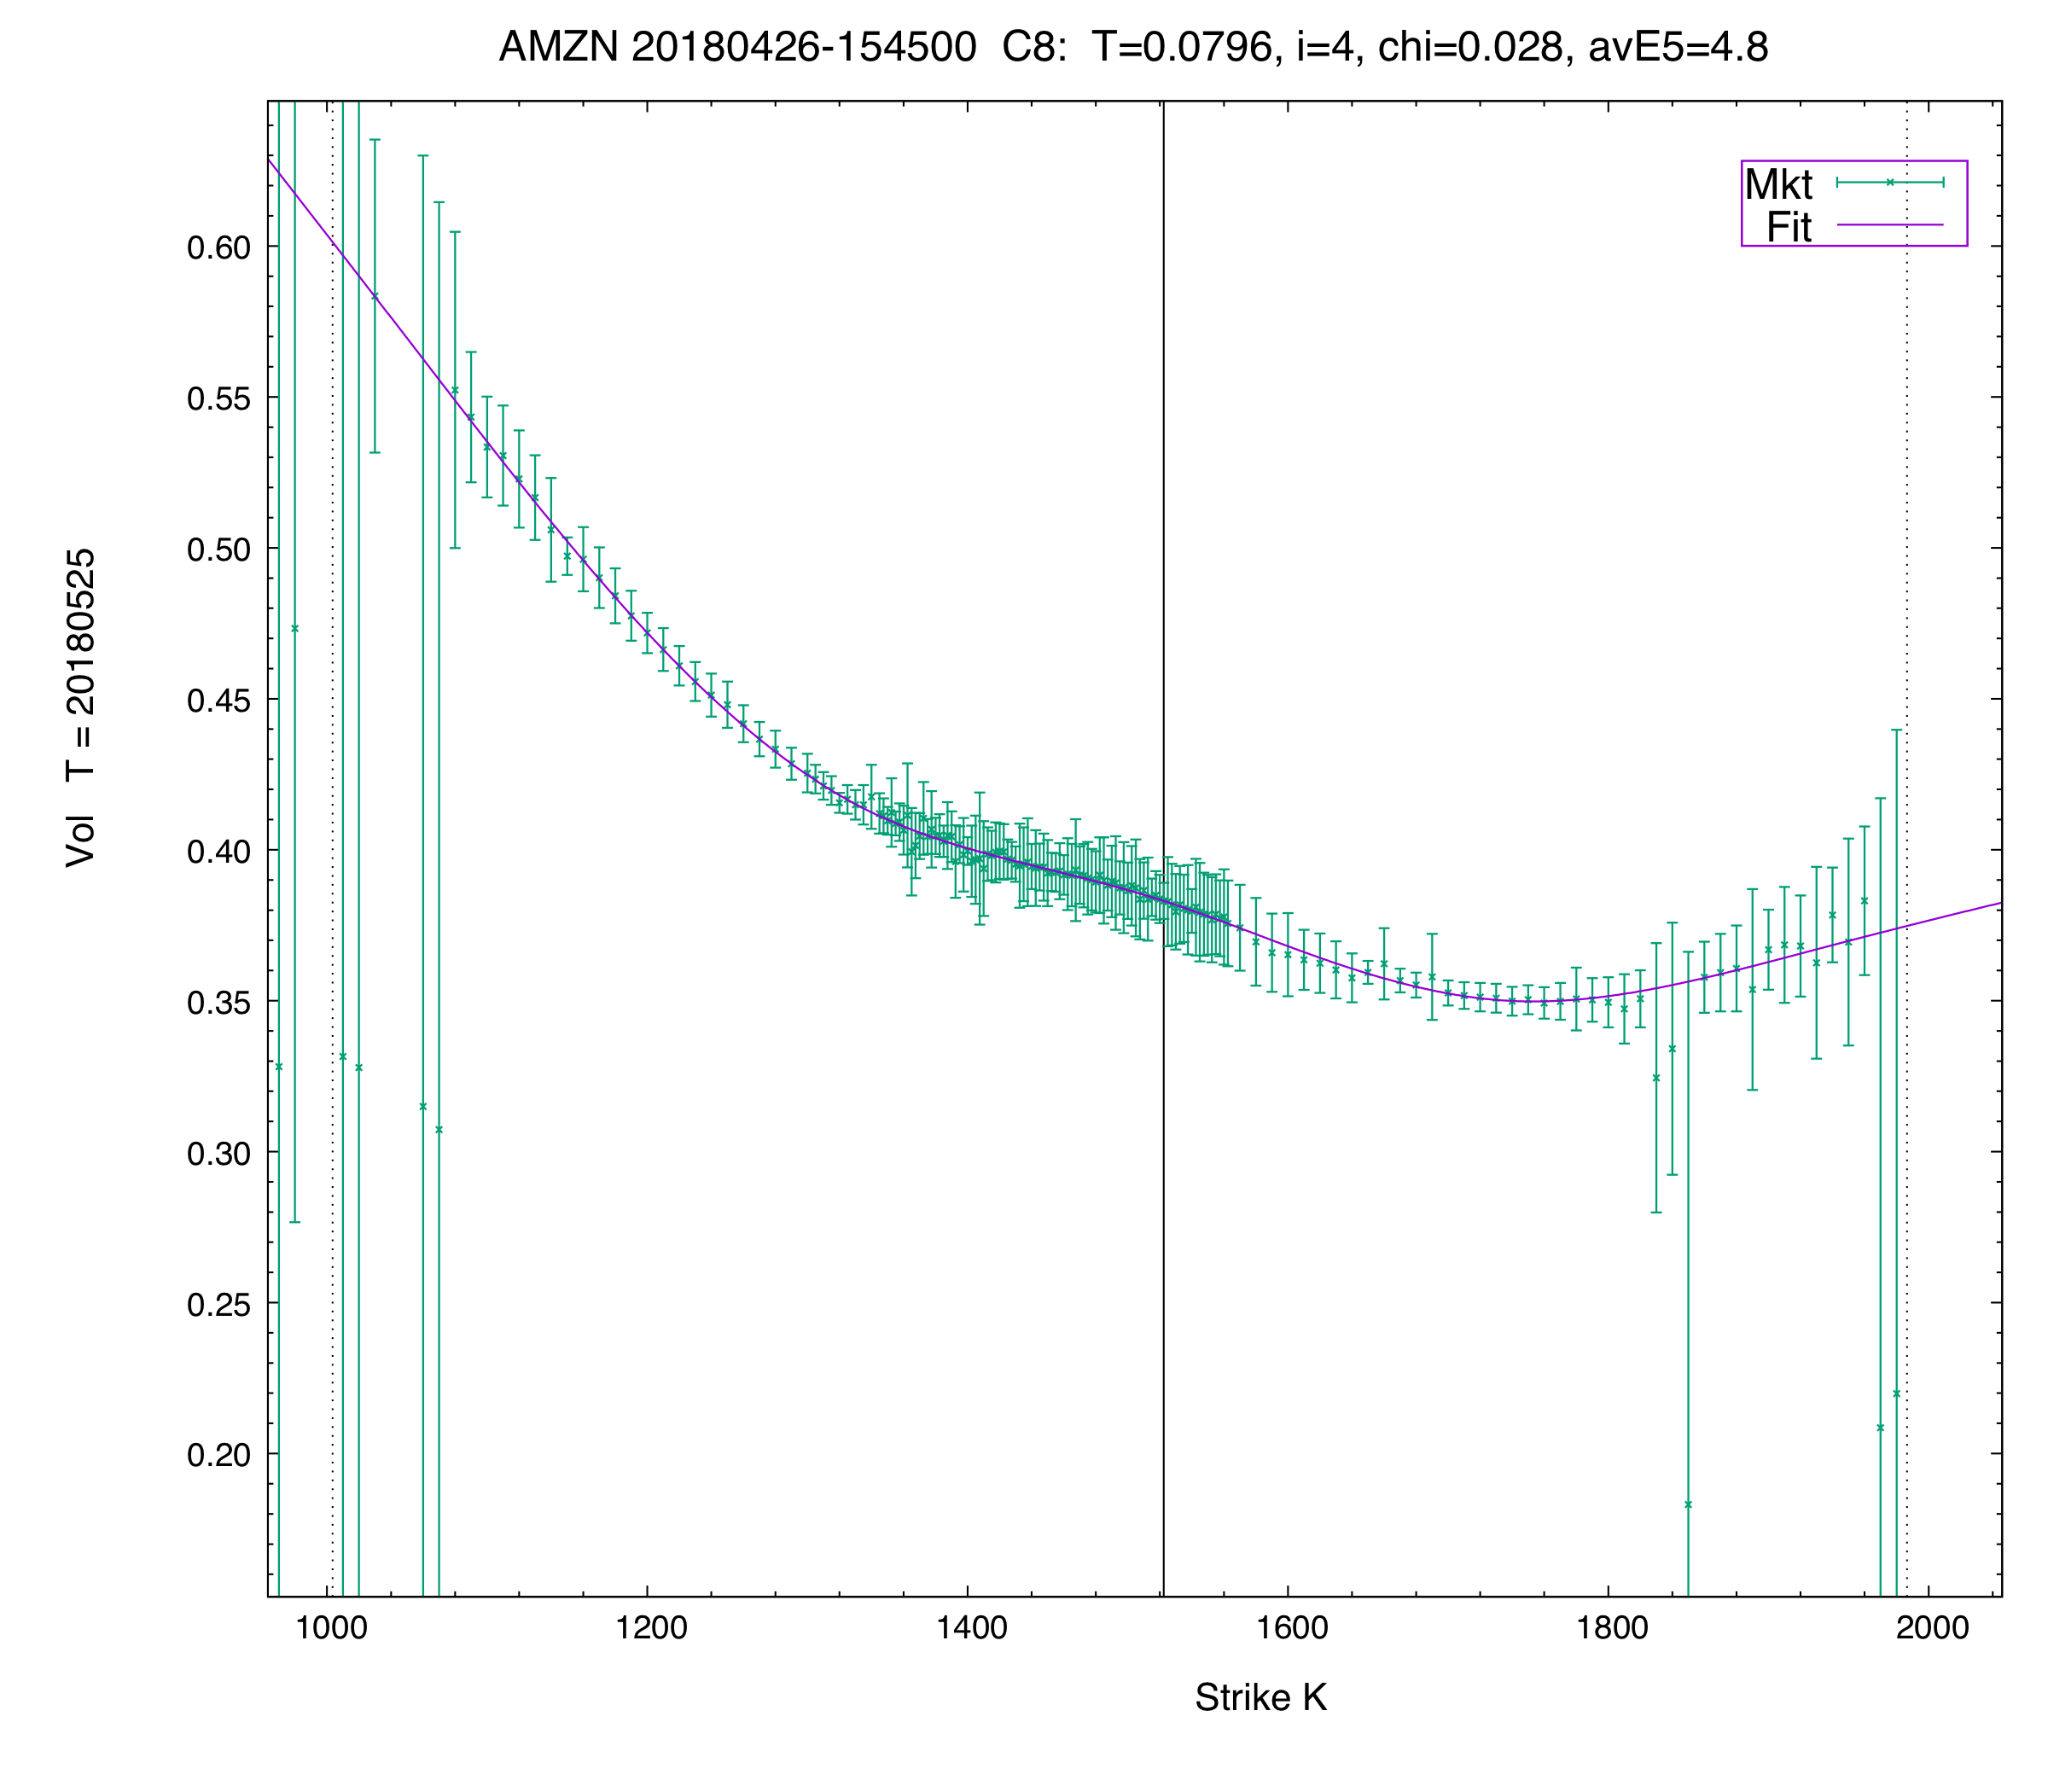
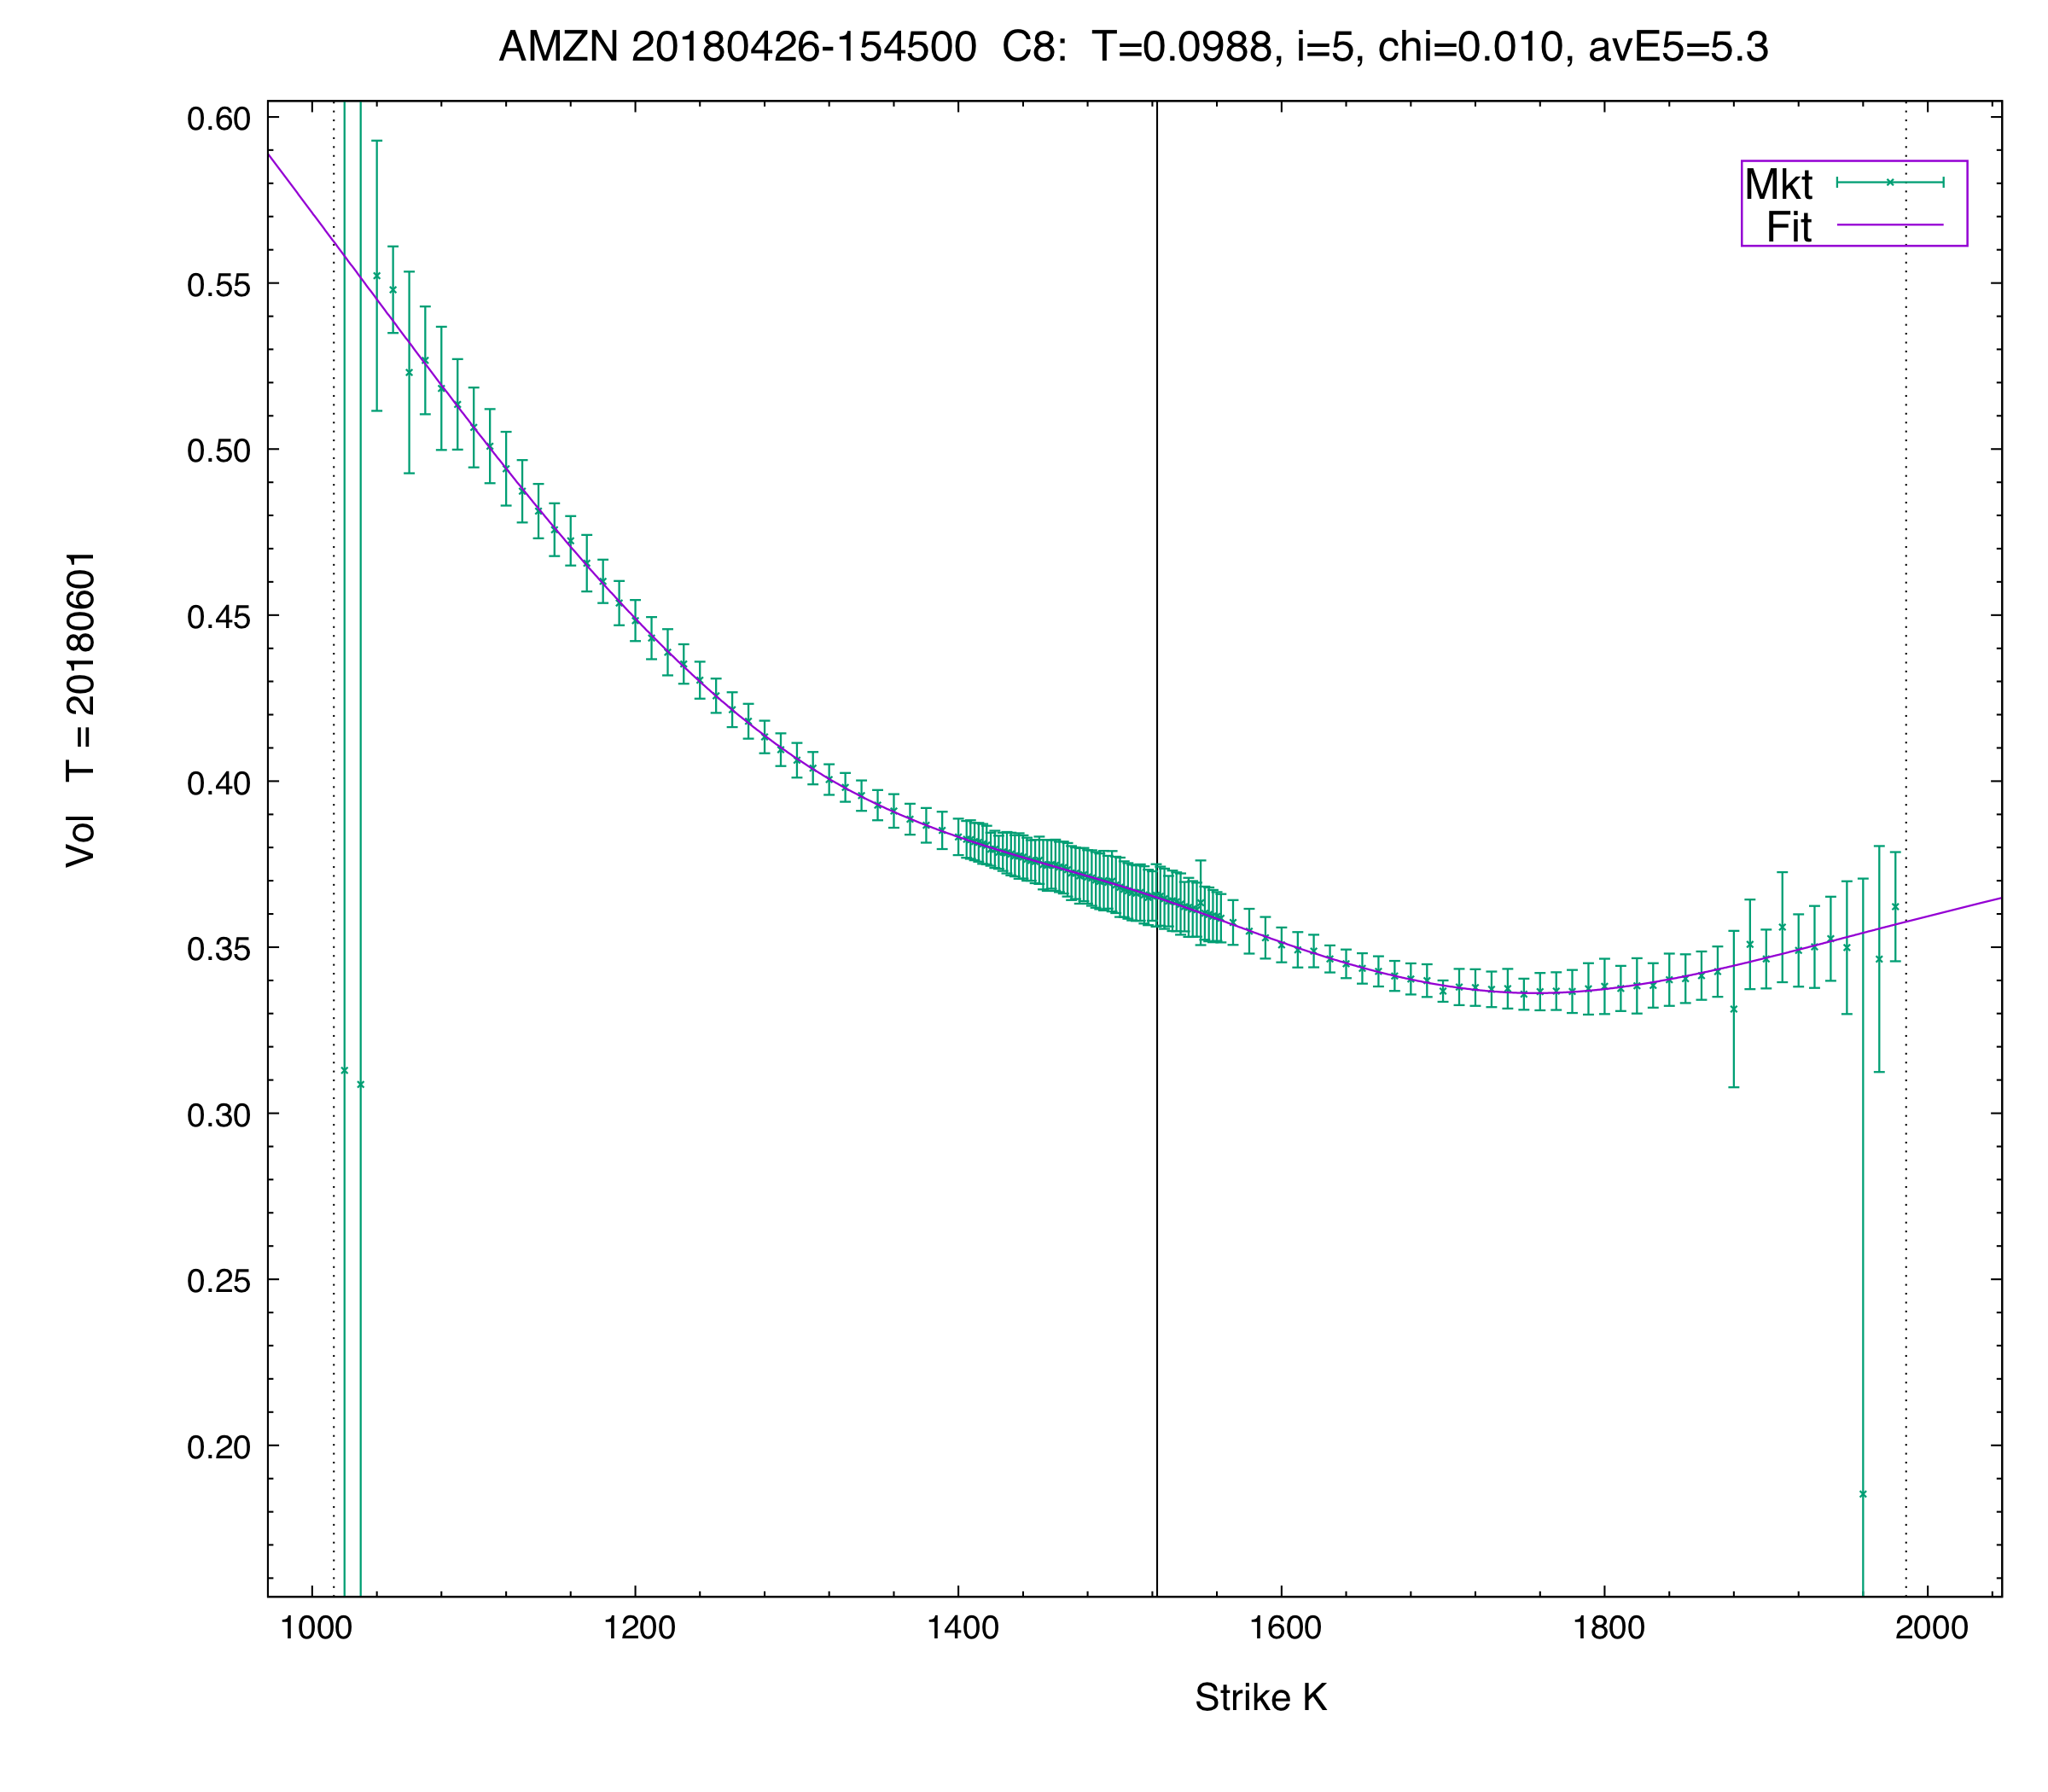
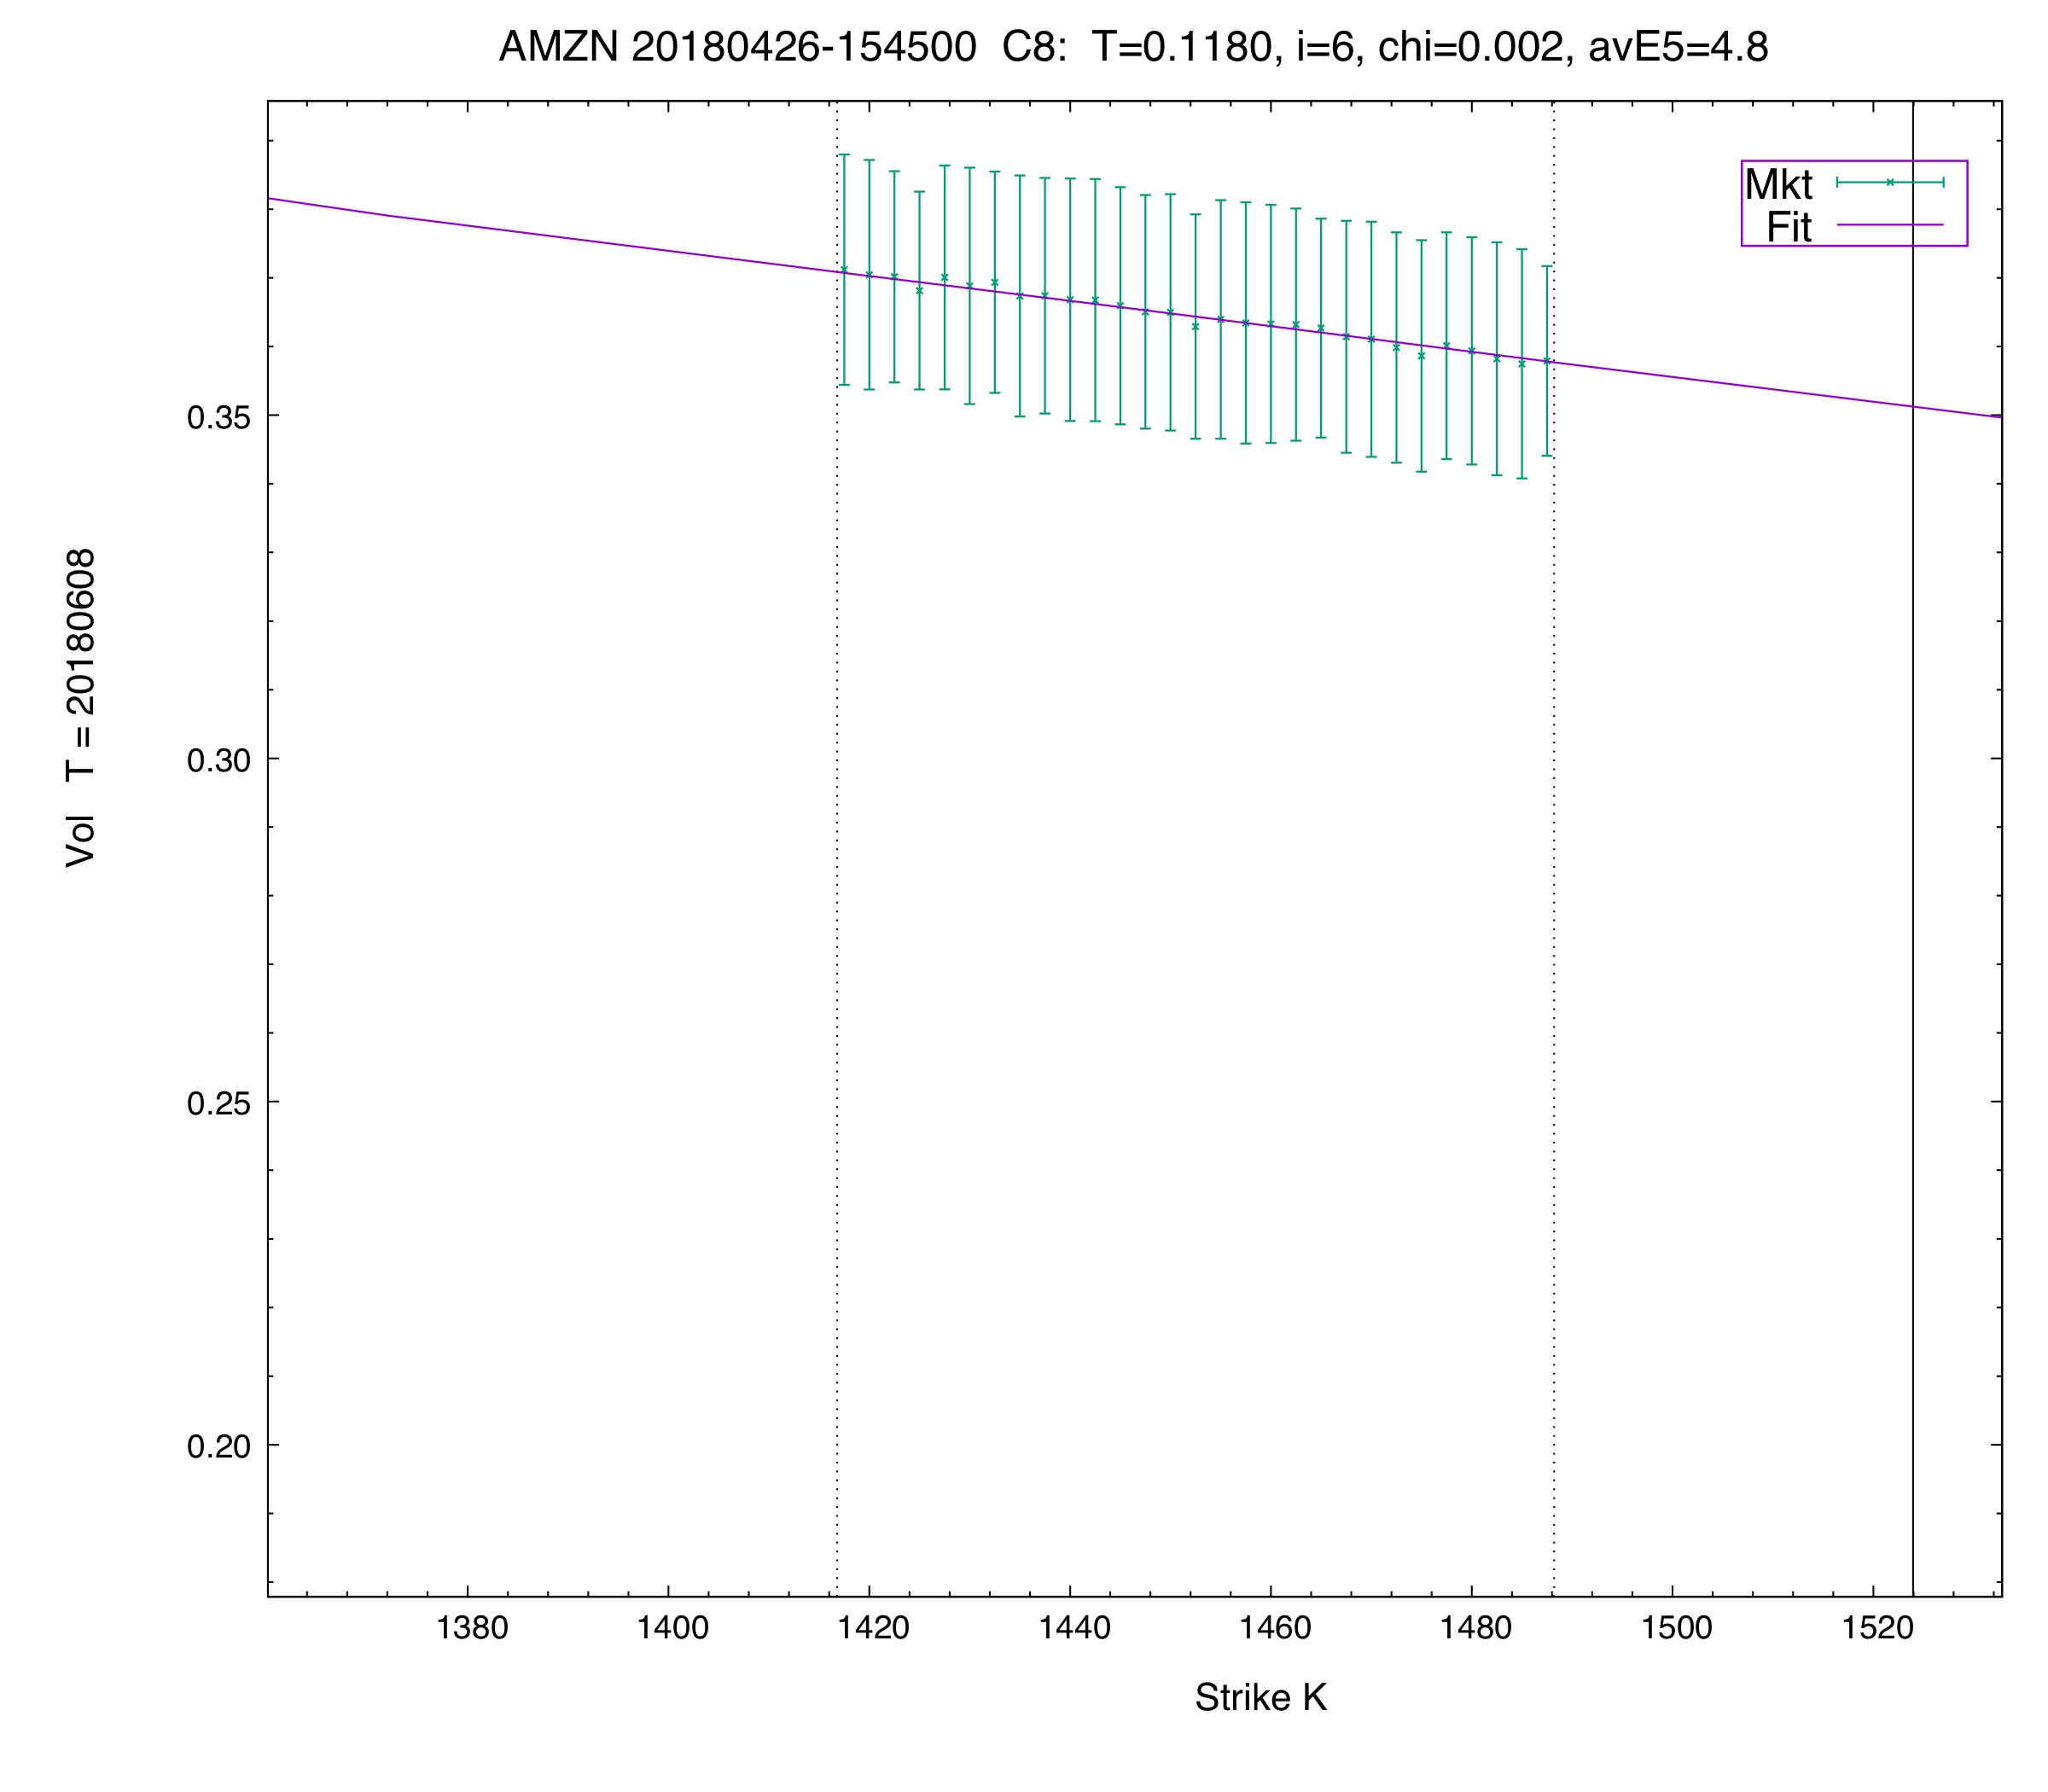
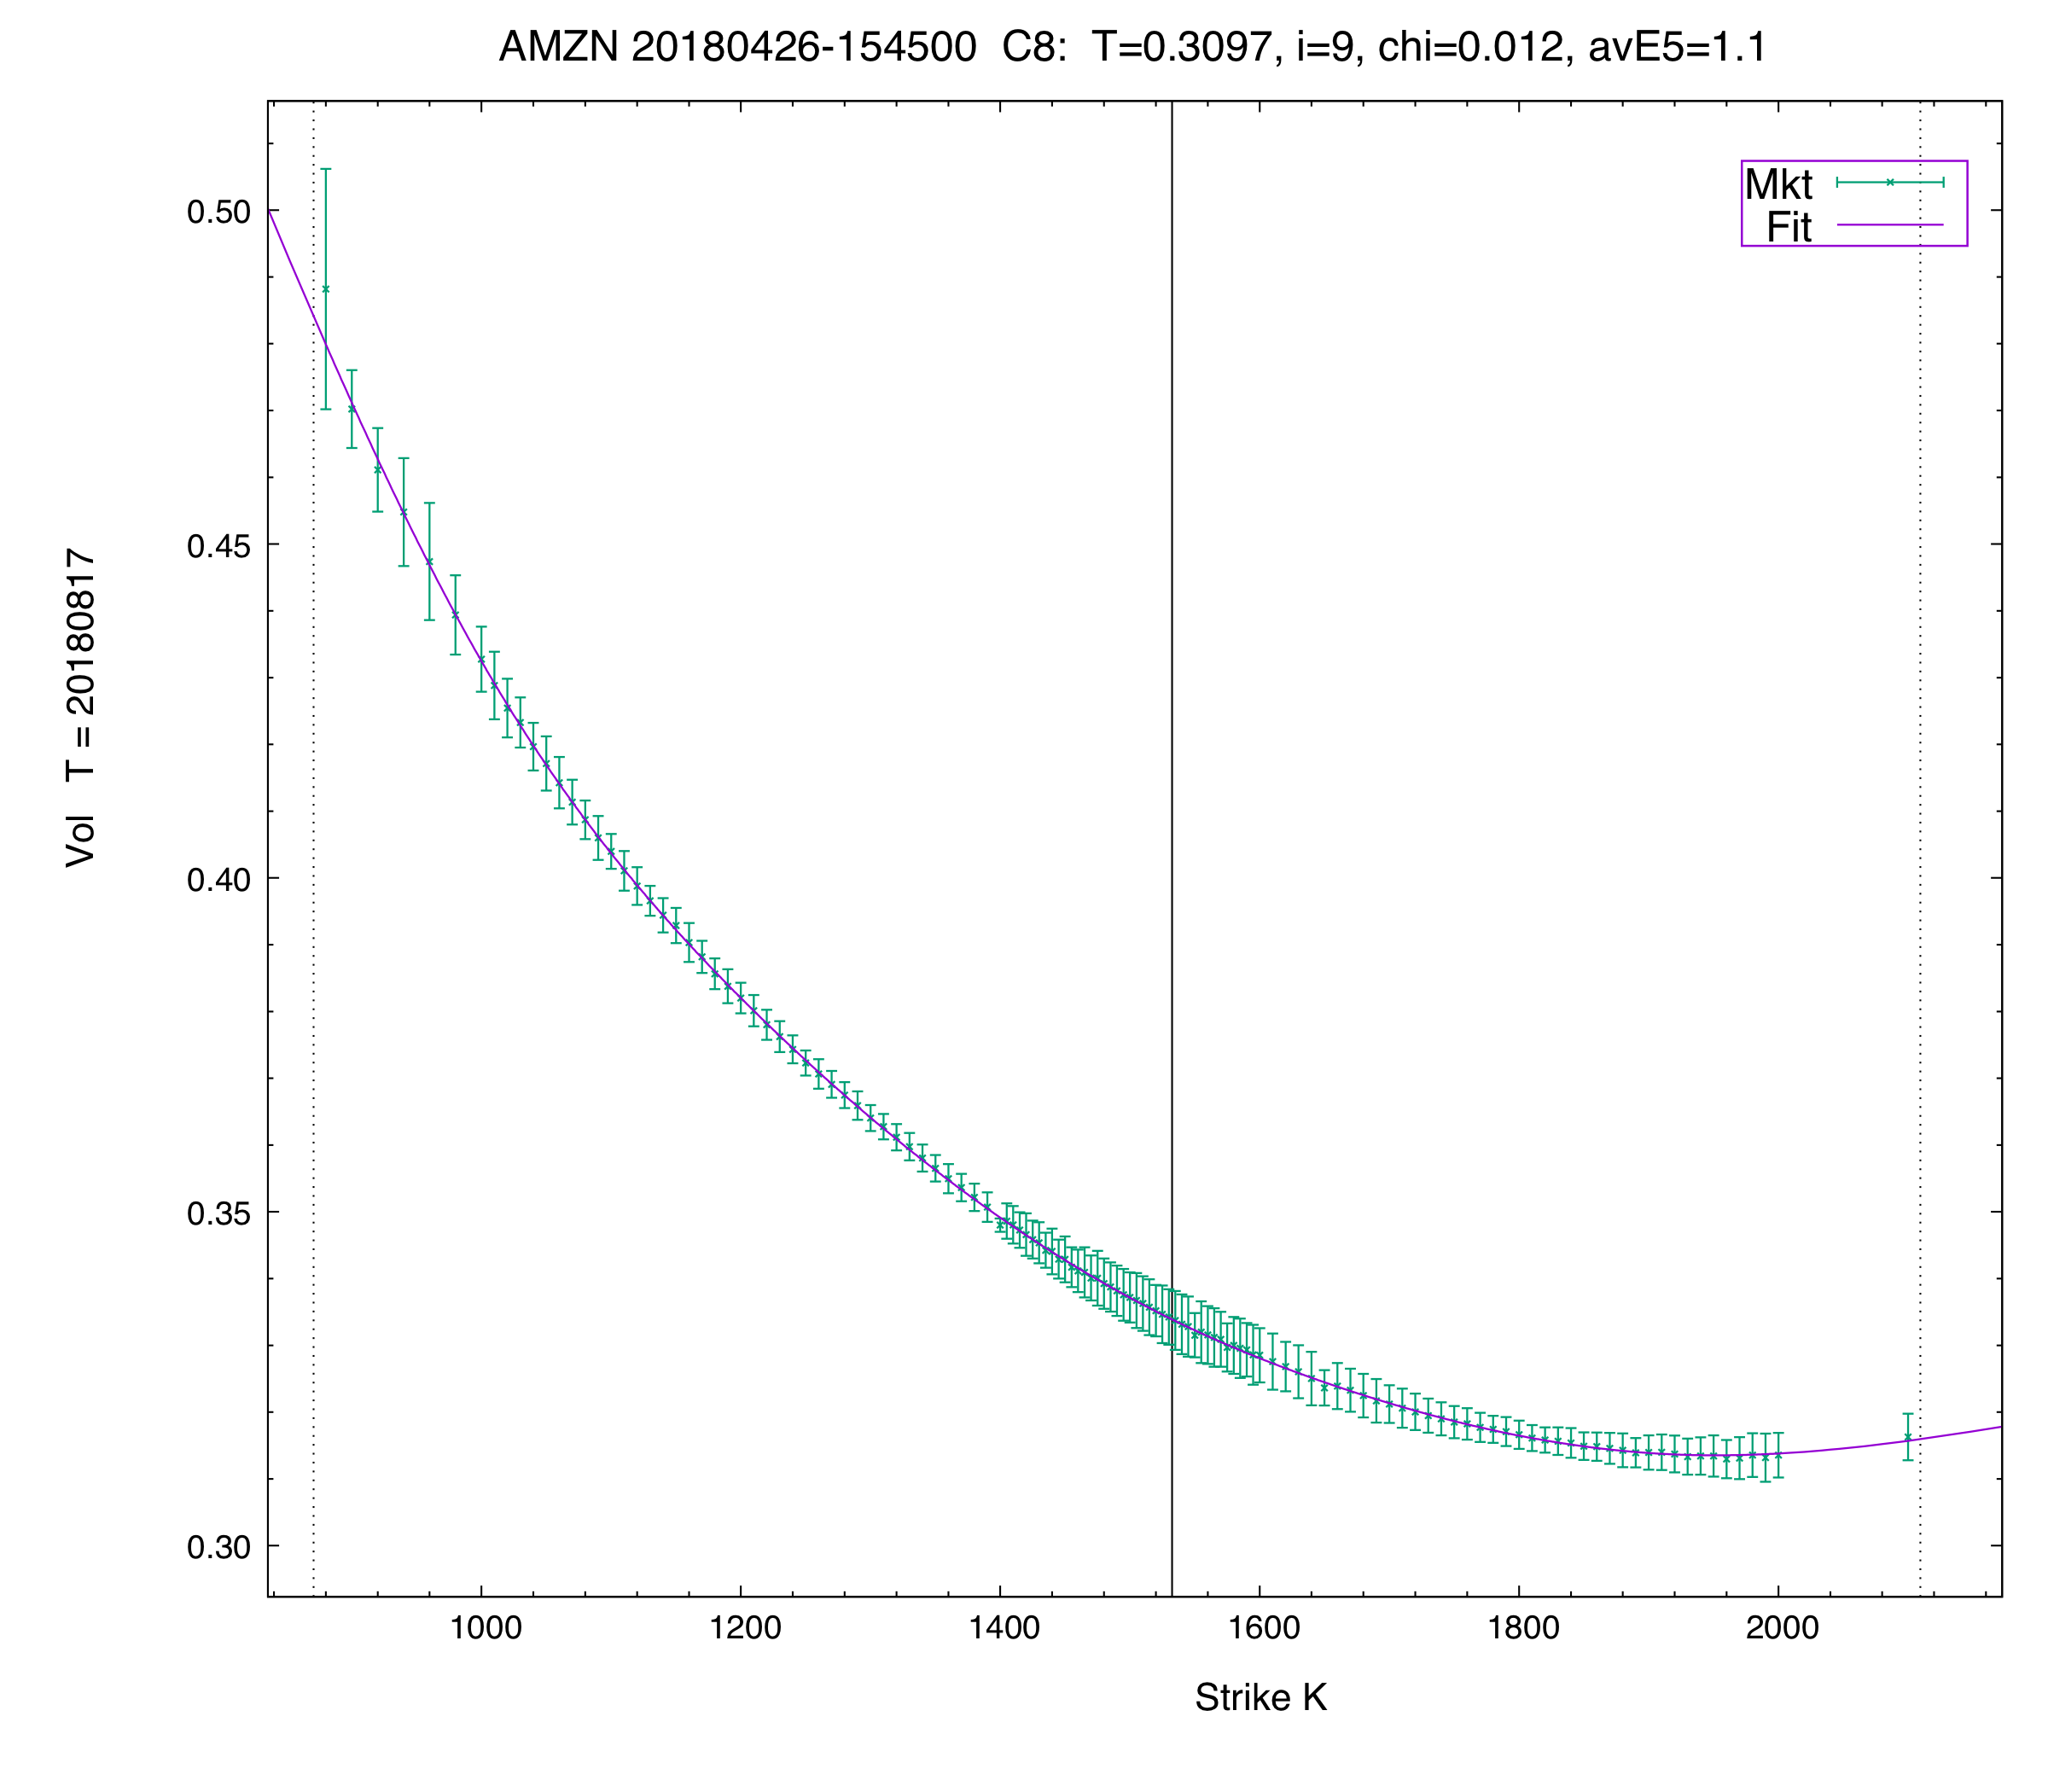
Here are the fitted and market implied vol-by-strike plots for a couple of the first maturities.
Note the i=6 expiry has a only a few strikes, but the fitter extends the fit in a perfectly sensible manner into the far wings (see also the plots above).