Example
Treasury Futures Options
Vol curves for equity options have been quite hard to fit for a while. In the last few years many other asset classes have also become much harder to fit. Examples are Asian indices, or various futures options, like crude or treasuries, as discussed below.
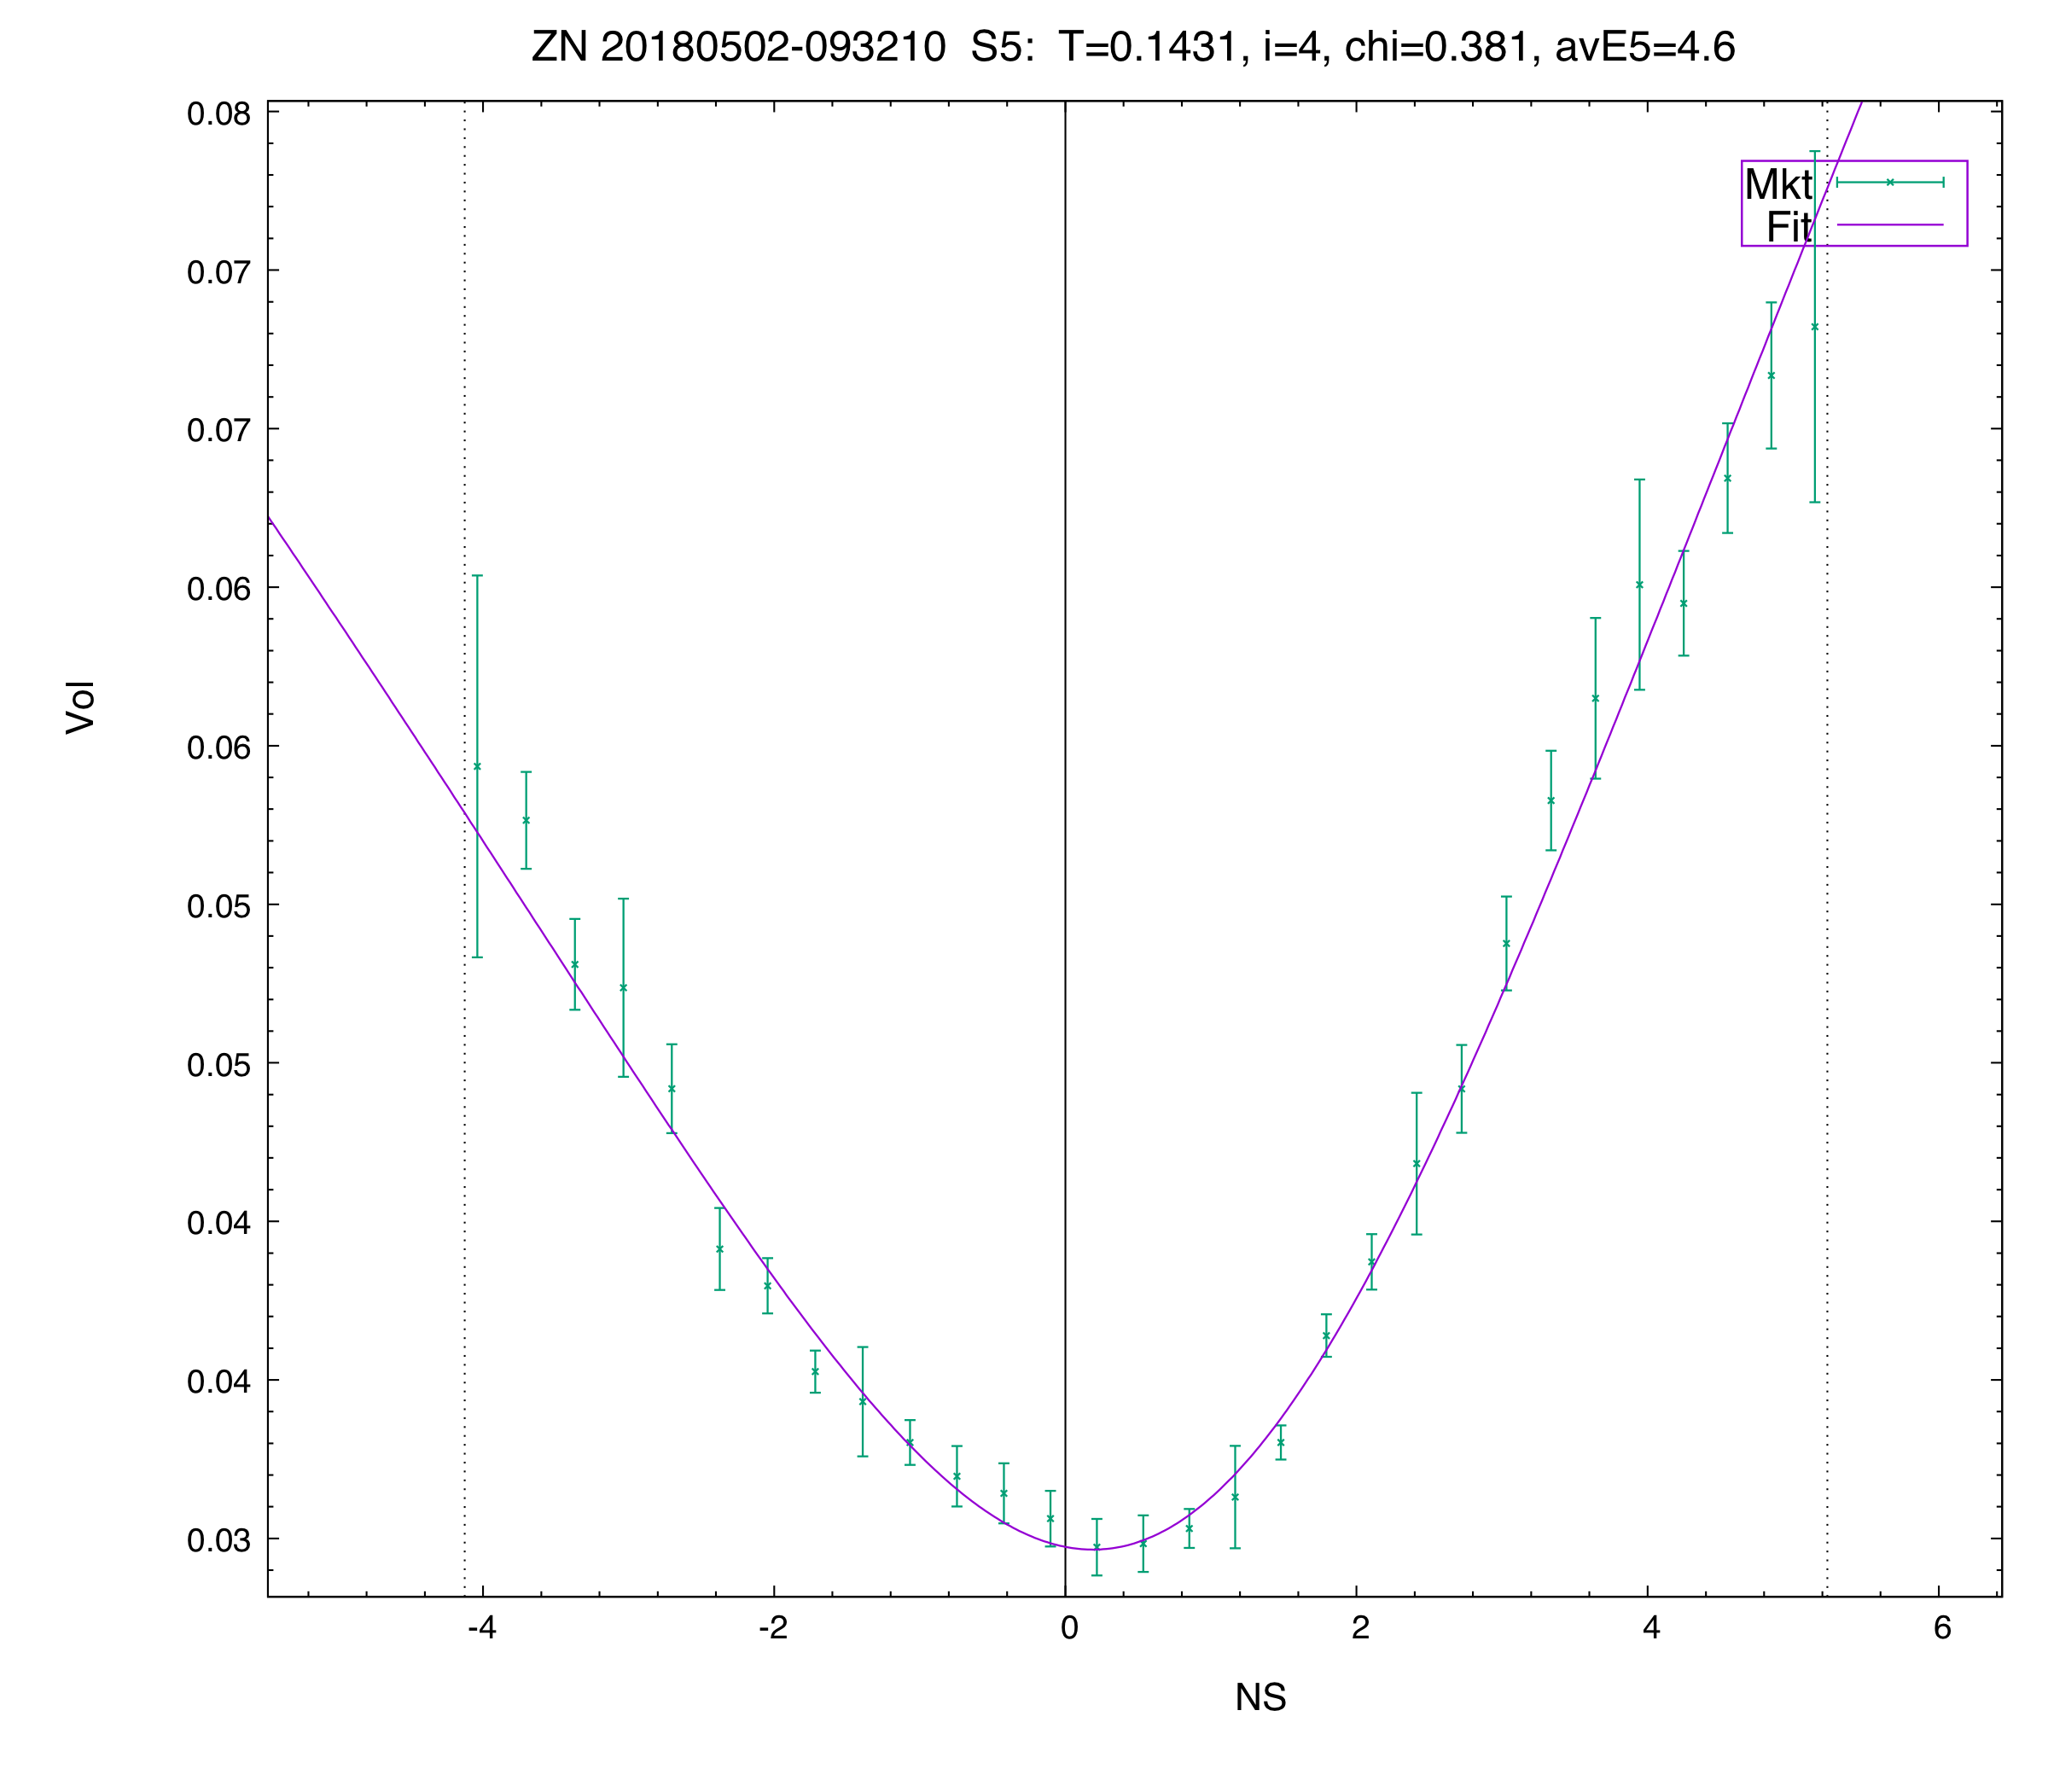
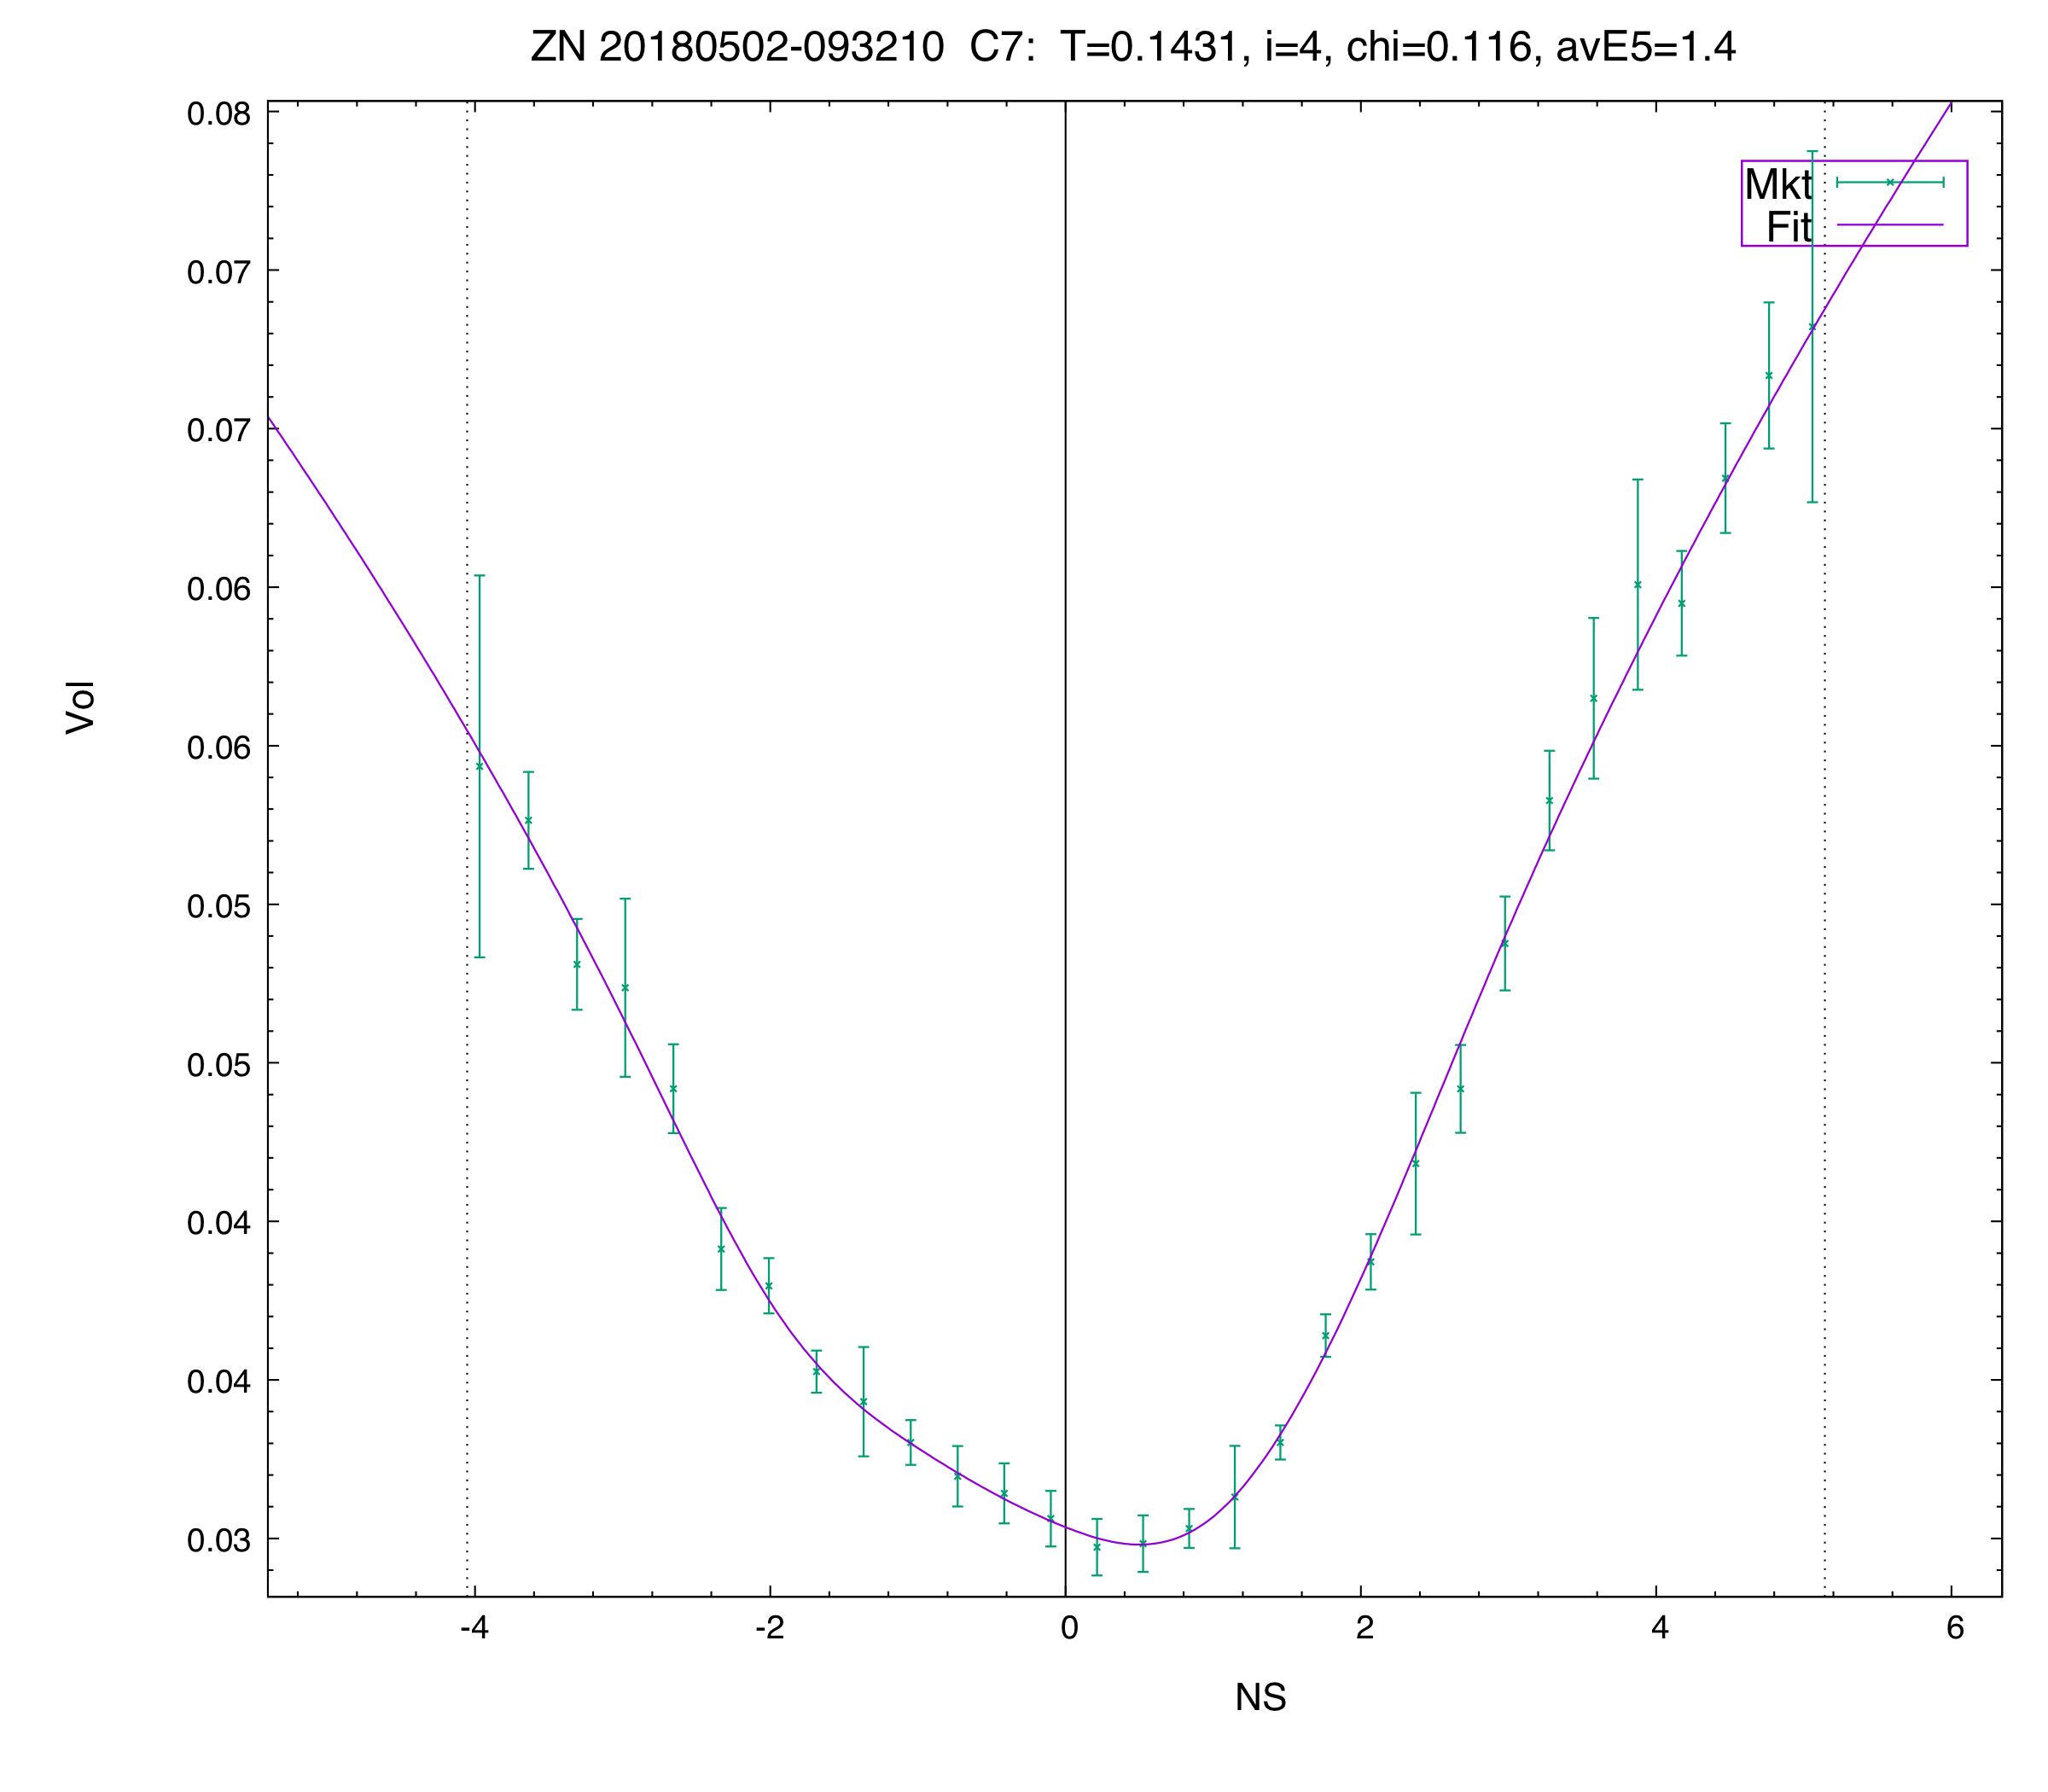
In the past it was possible to fit options on 10-year T-note futures (“ZN”) using a simple curve like the 5-parameter SVI (aka S5) curve. Not anymore; a bias-free fit across listed strikes for all terms requires something like our C7 curve these days.
Some examples, from 2018-05-02 at 9:32:10 CDT, are shown below, comparing S5 (left) with C7 fits (right).
First we show the June monthly expiry (T=20180623):
And here the August monthly expiry (20180825):
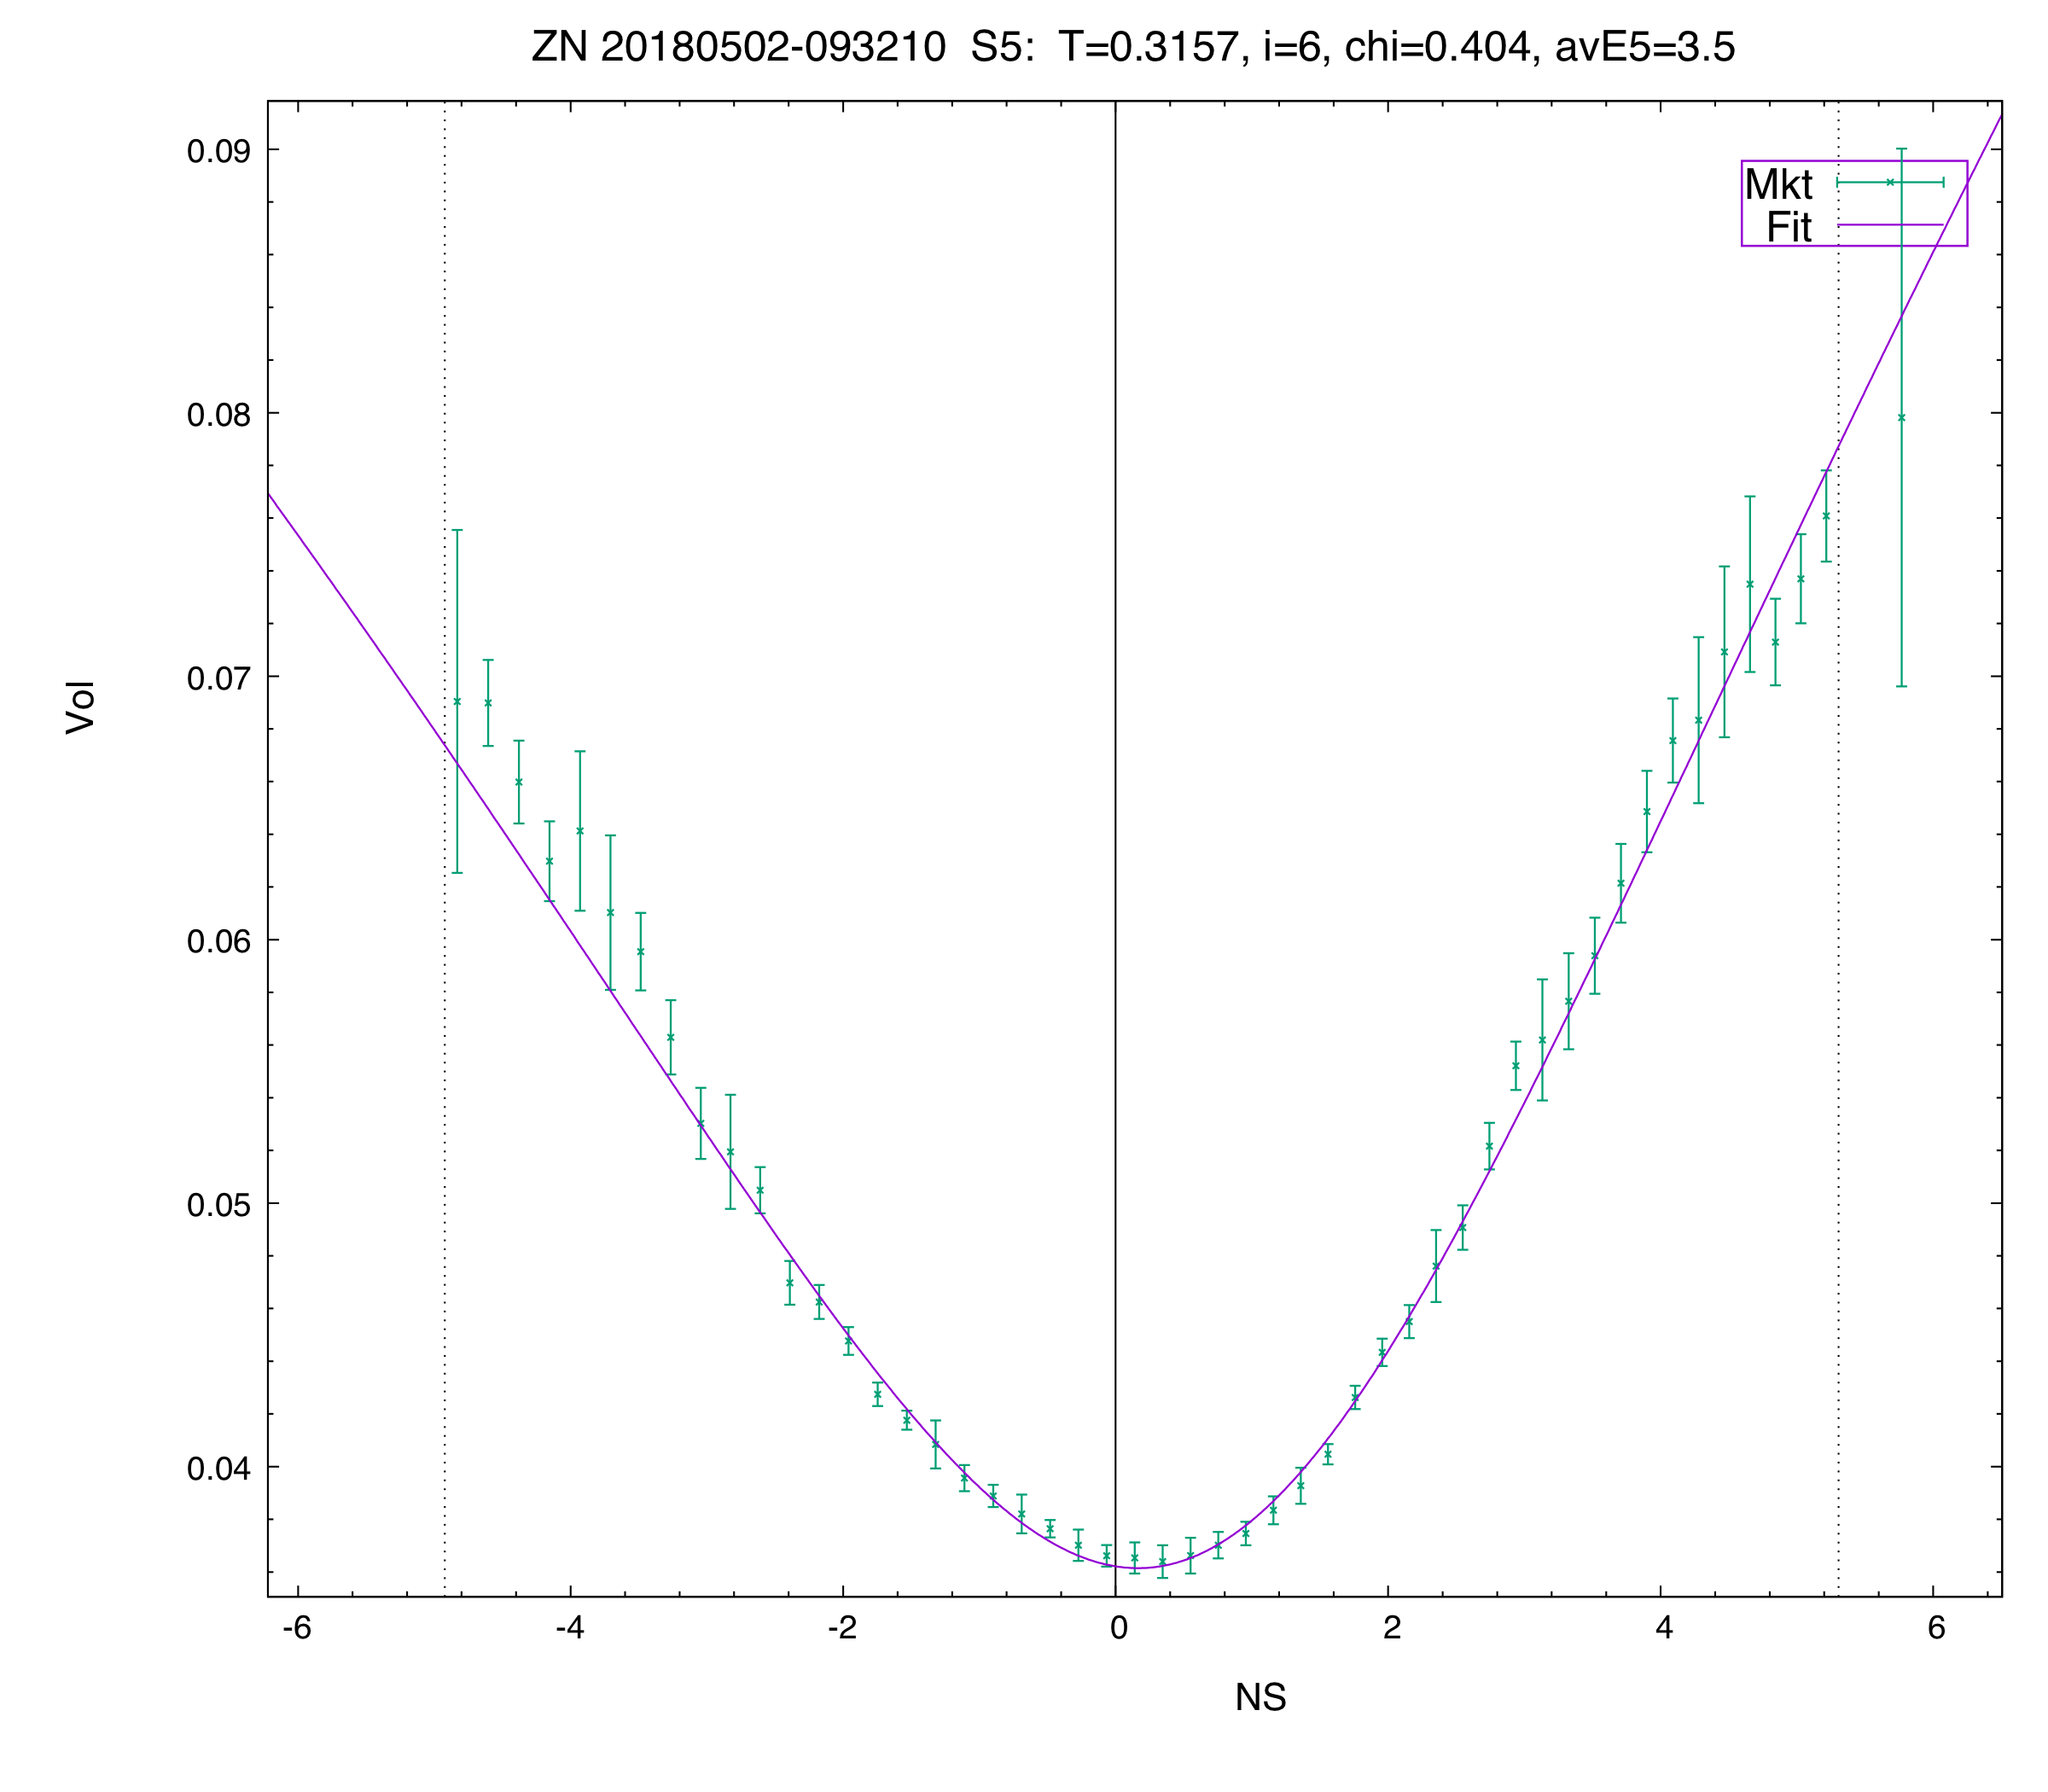
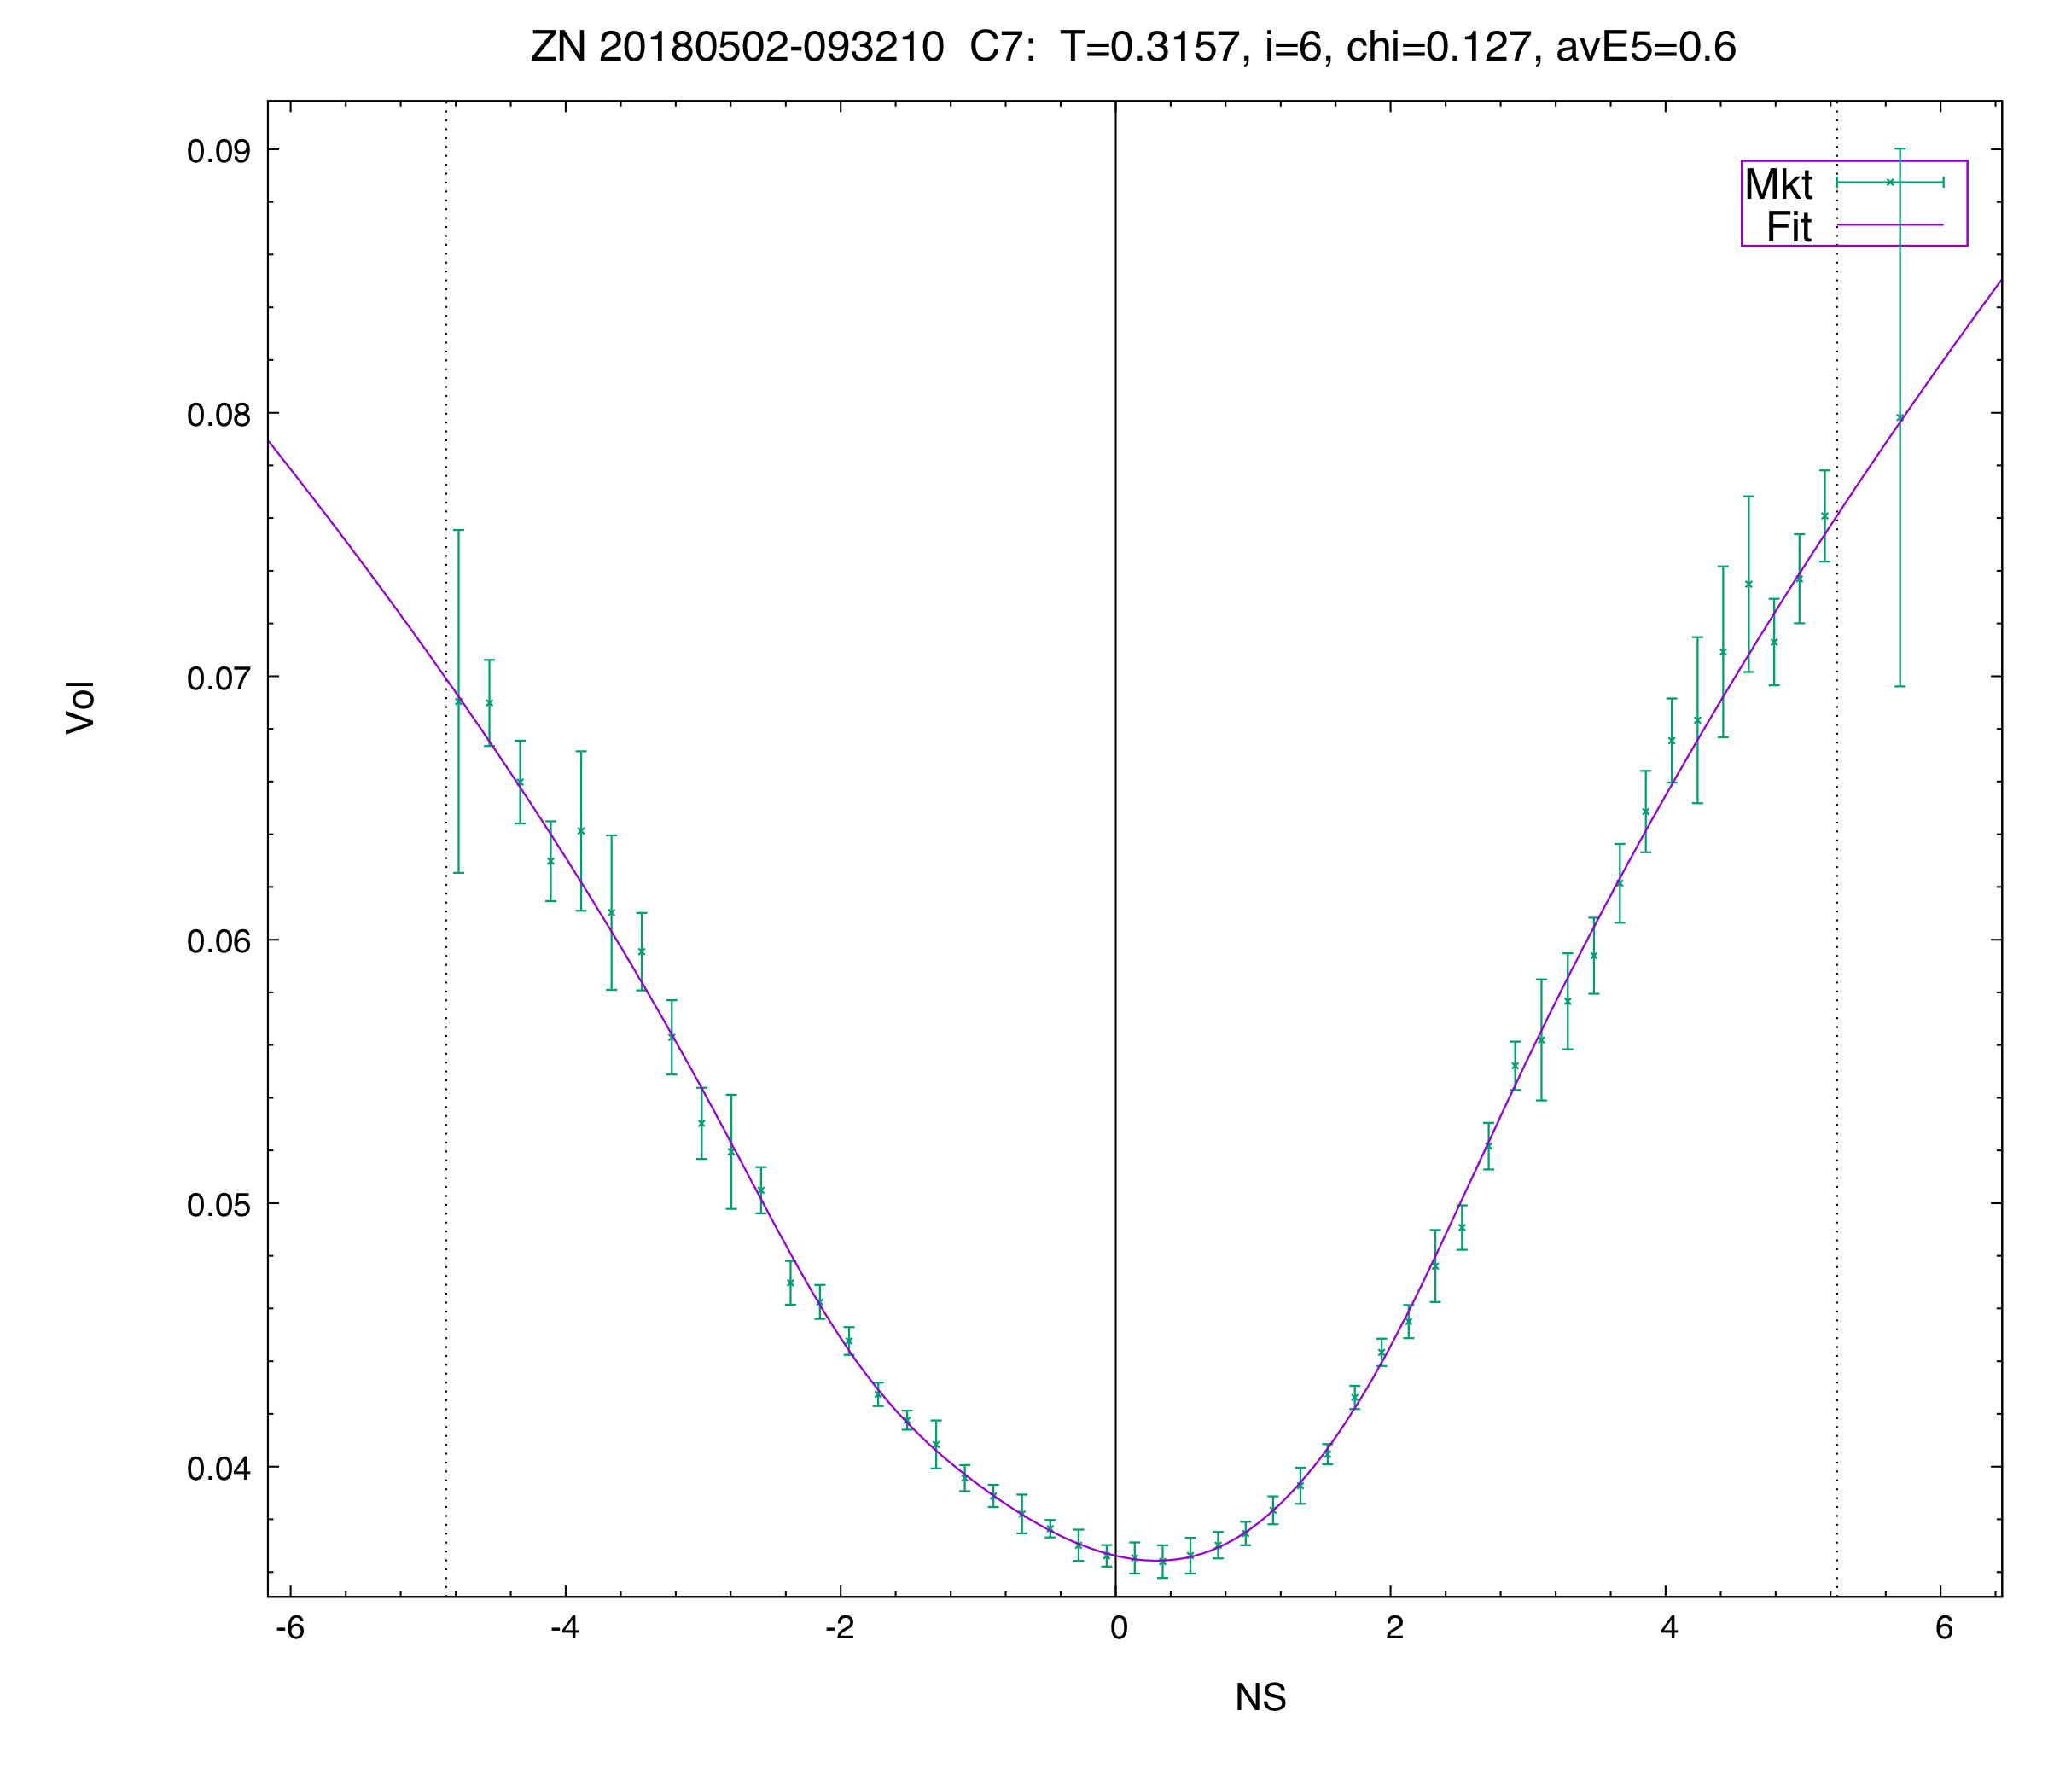
The differences in the chi2 and avE5 metrics are quite dramatic — the S5 fits are at least a factor of 3x worse. The differences are visually even more obvious in the vol-difference plots, shown below for the August expiry:
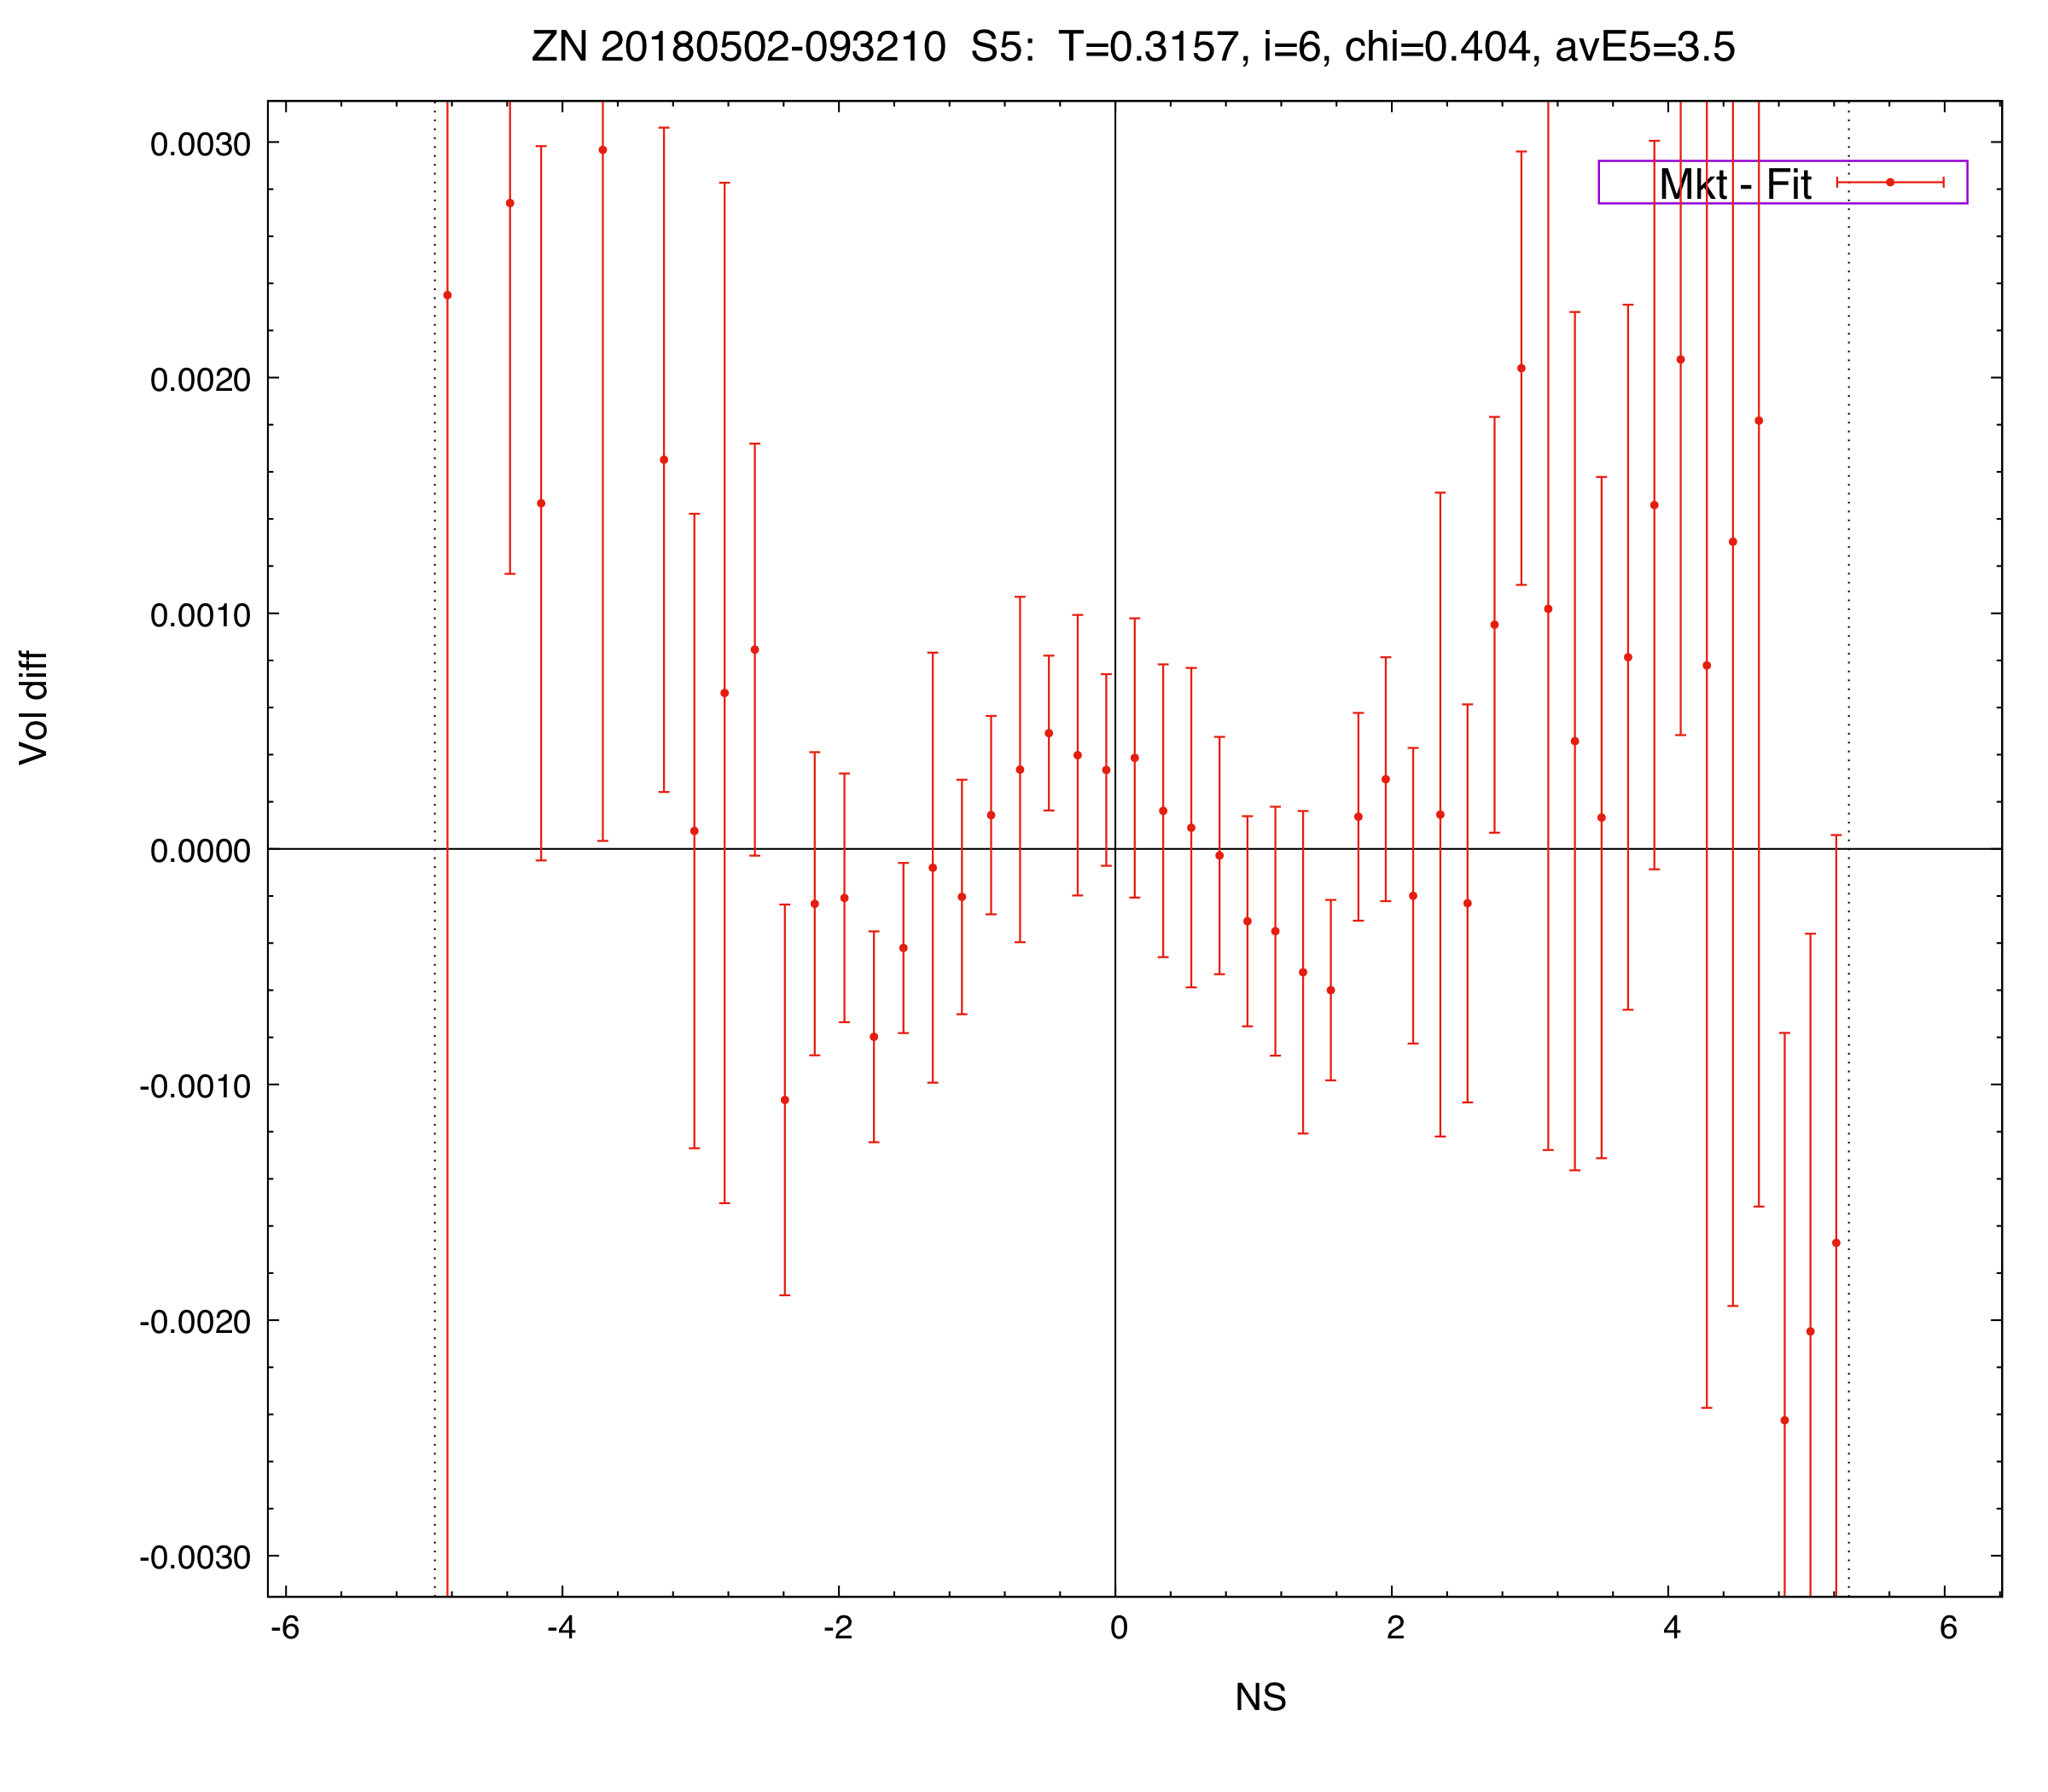
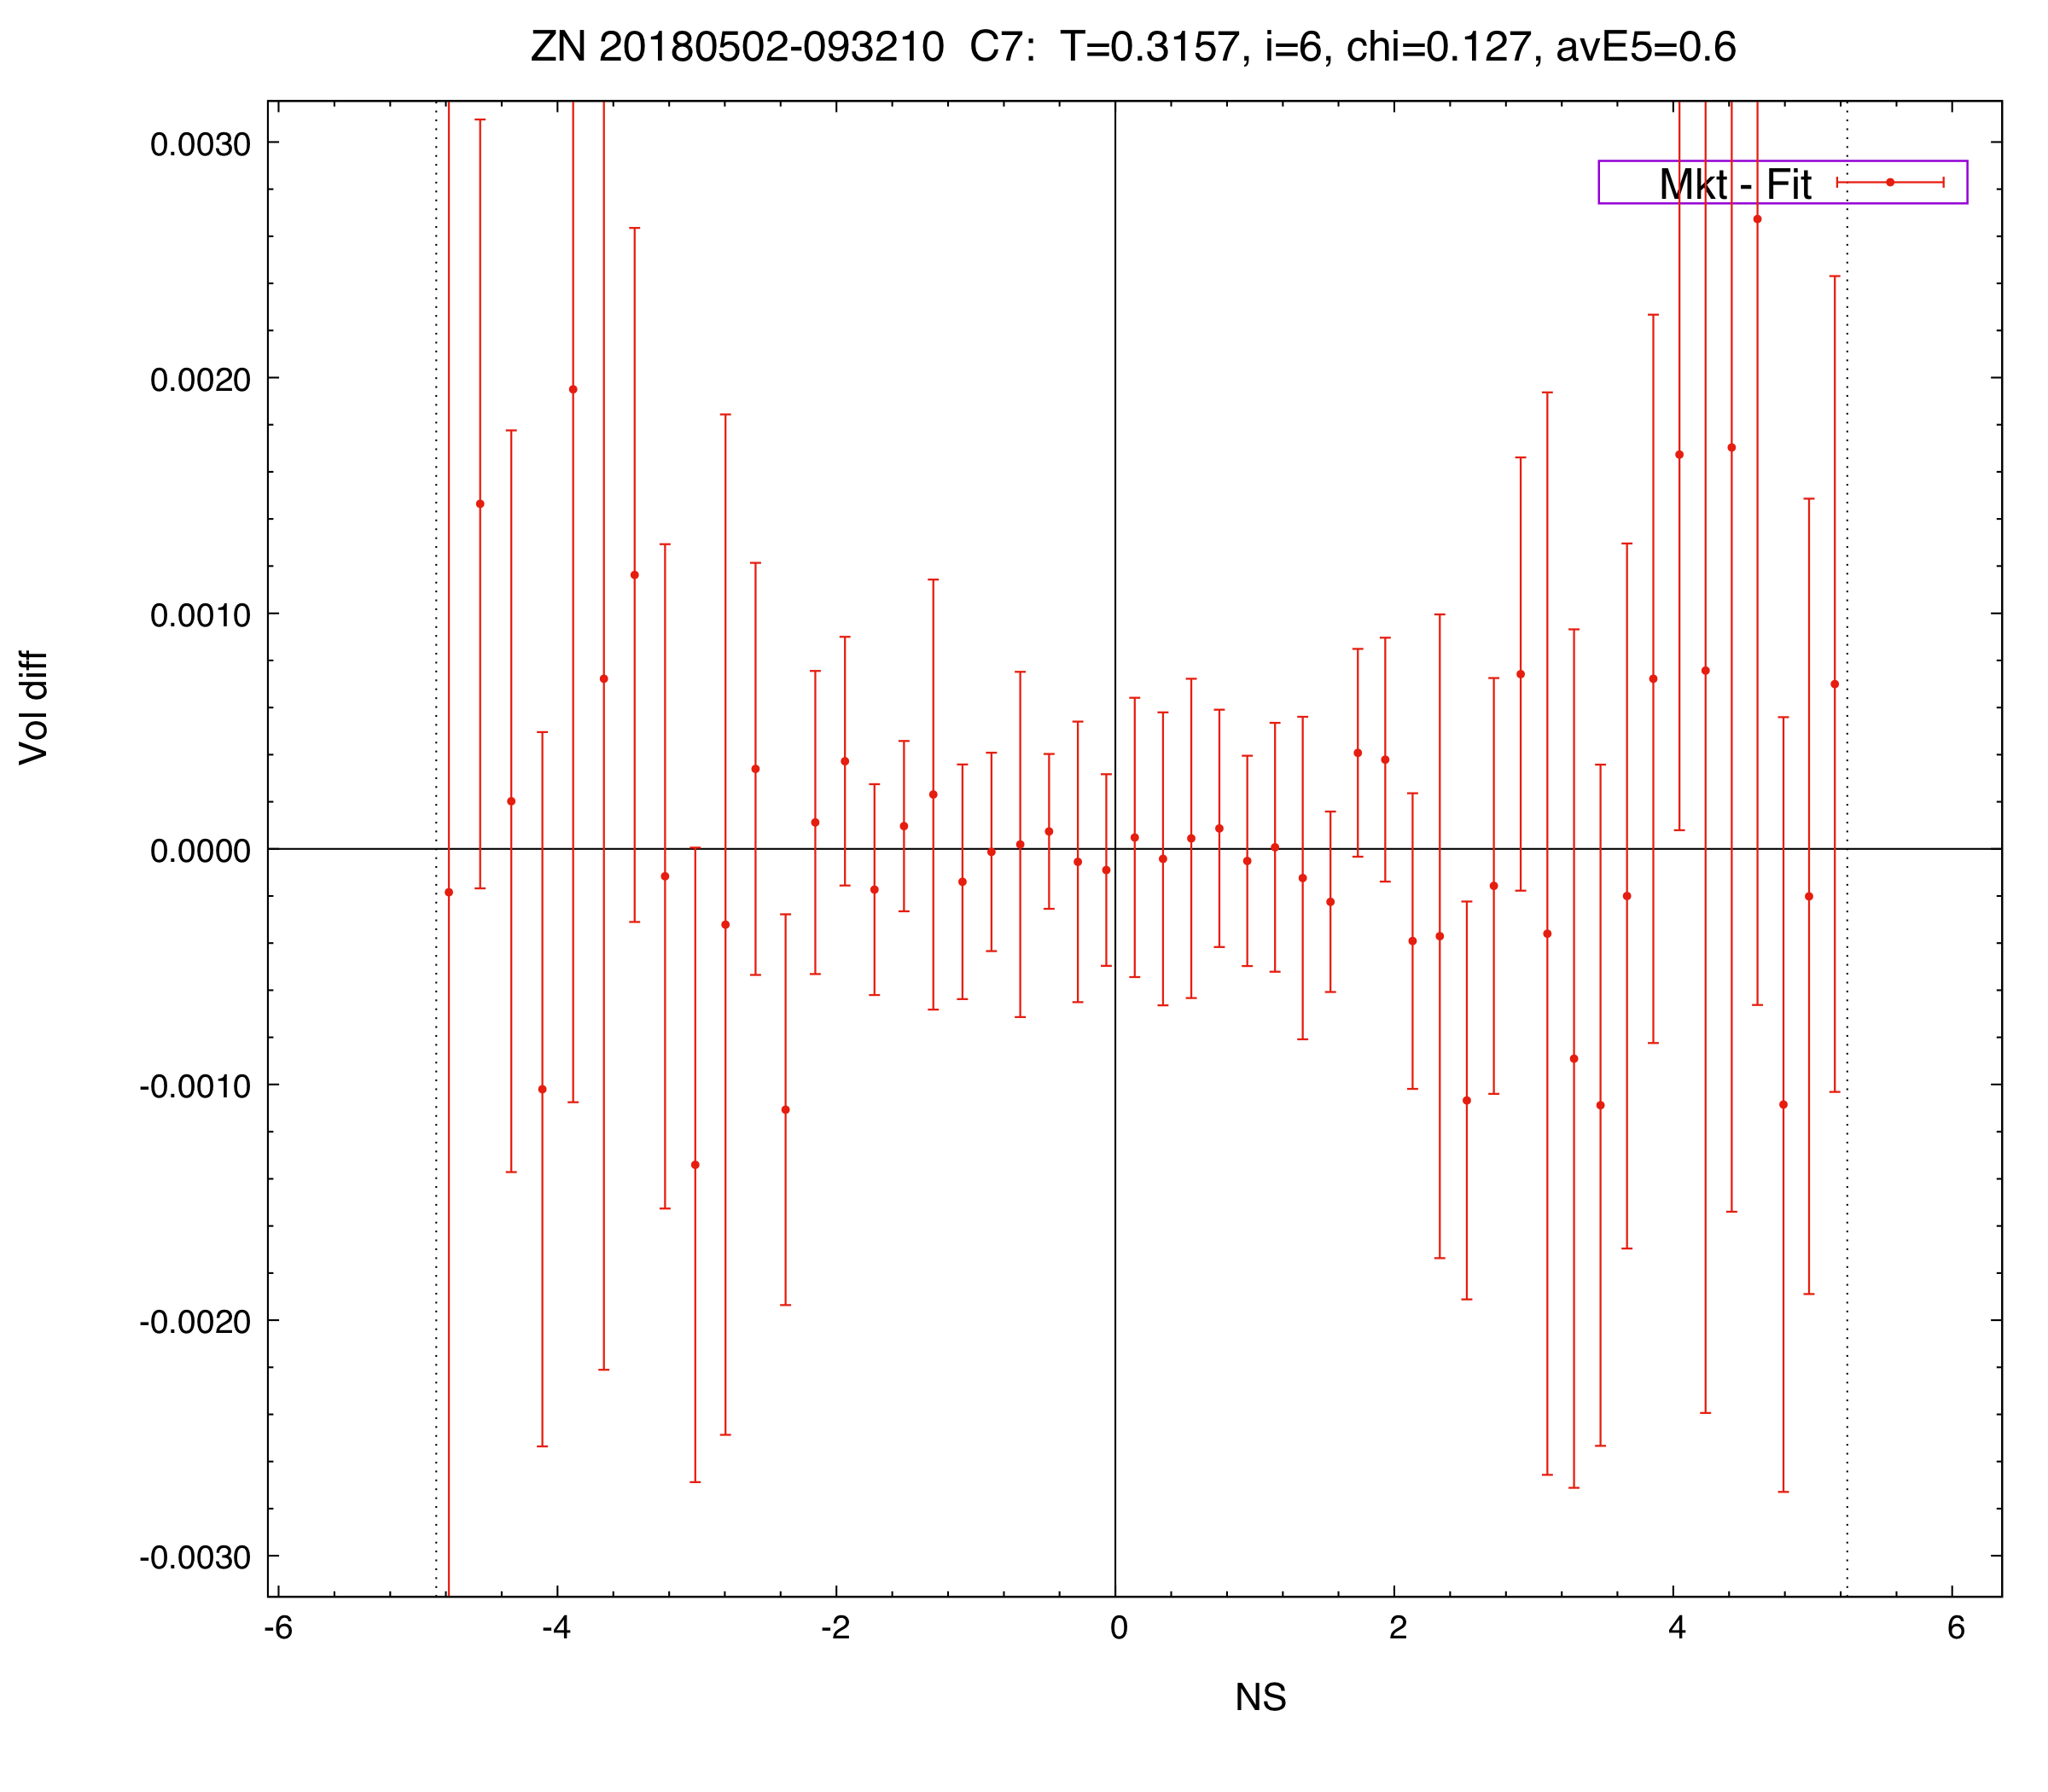
Note that the data in the wings seem to be a bit noisy (actually, these are mostly “tick-size quantization effects”). As is usually the case, the curves are better than the (naive) market.
All volcurve fits are free of butterfly arbitrage, and part of a volsurface that is also free of calendar arbitrage. The latter is achieved, as usual, by information transfer from liquid to less liquid terms.
Our clients trade off these curves!