Example
Next Generation Curves
Beyond SABR, SVI, etc.
Beyond SABR, SVI, etc.
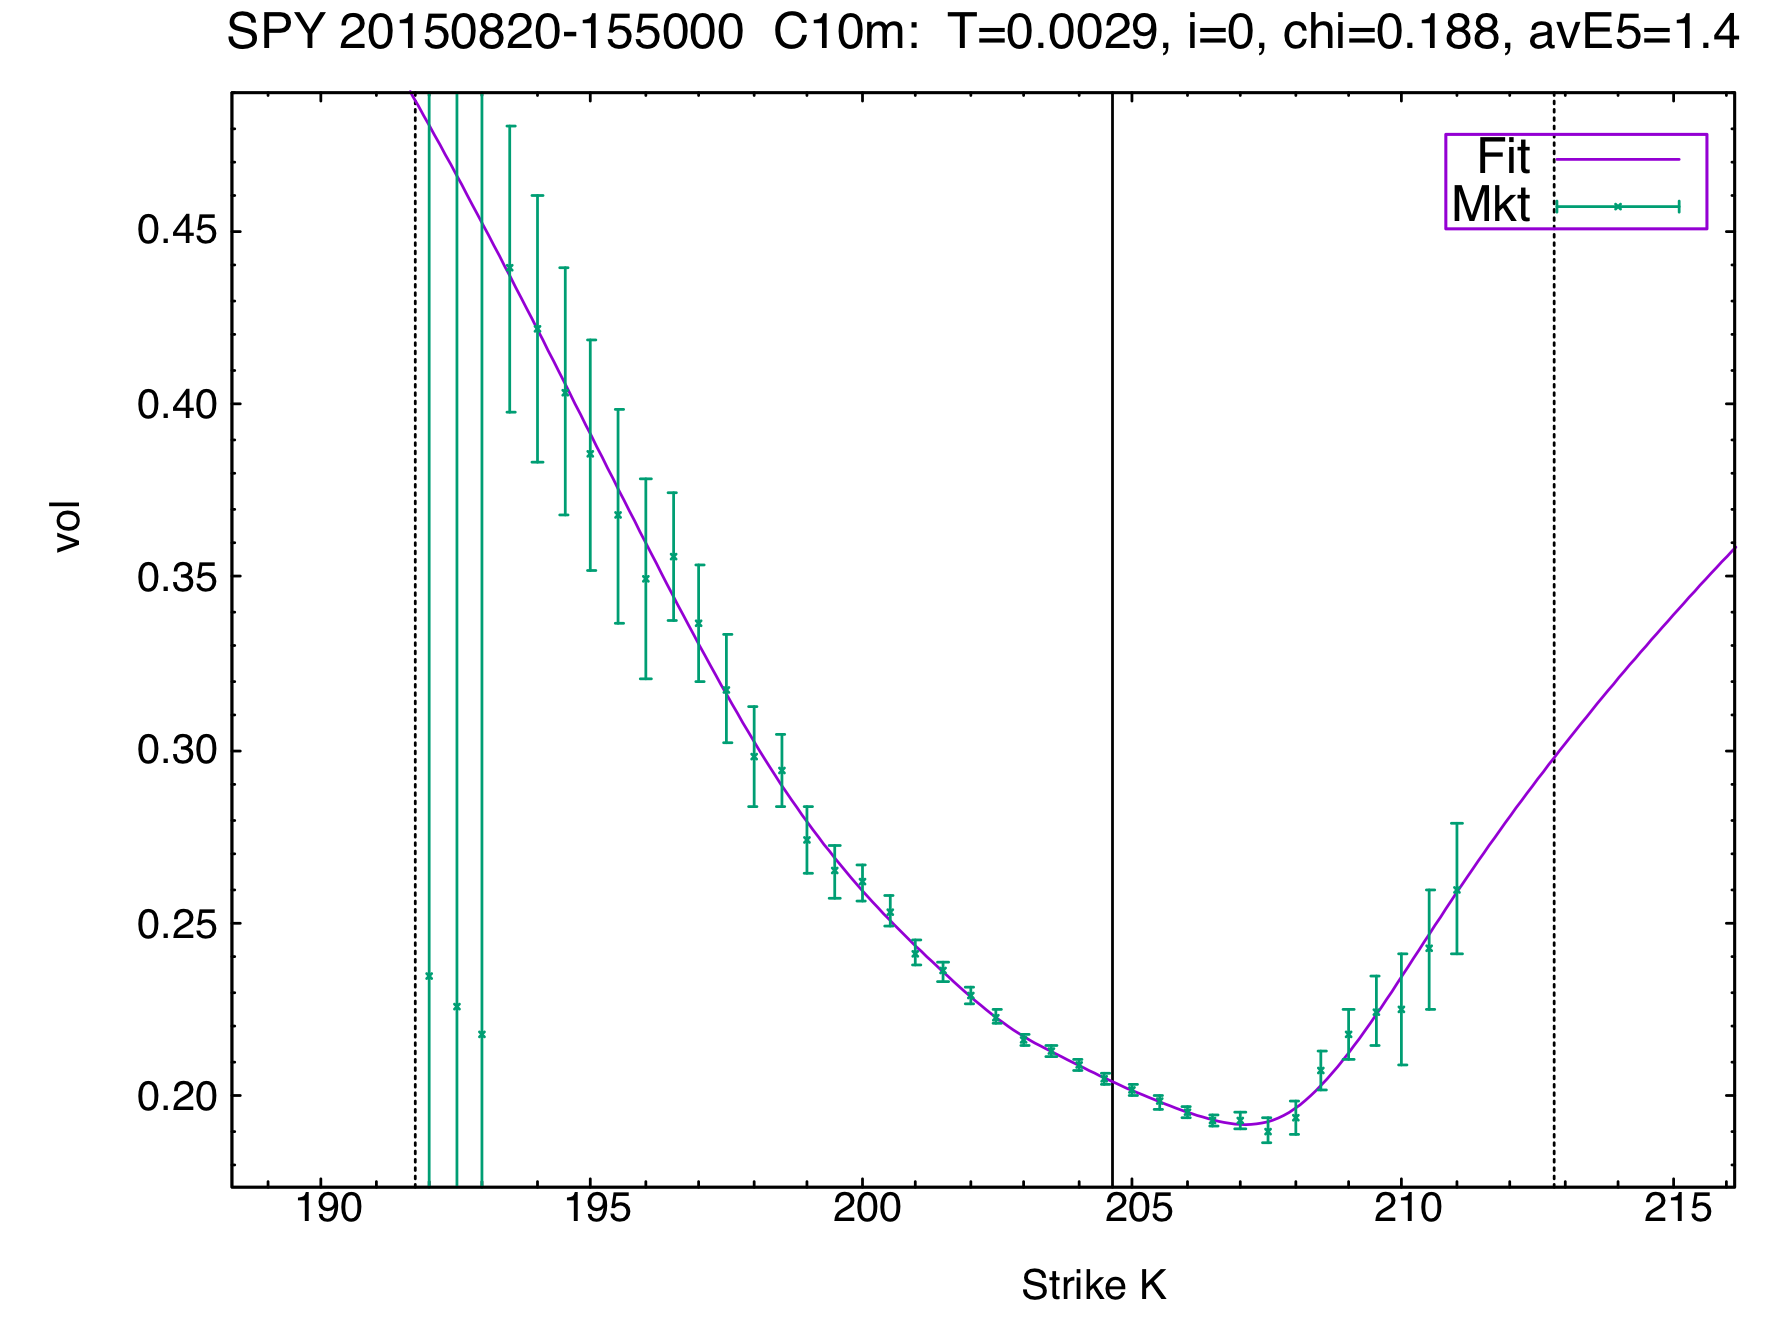
A serious vol fitting framework requires sensible quality-of-fit metrics that are produced and can be used programmatically.
Our infrastructure produces several by default and here we mention two of them, that are shown in all our vol plots (in the title on the right): The reduced chi-square (“chi”), and the average absolute difference between fitted and market implied vols for 5 strikes around ATM, in bps (“avE5”).
The former is a measure of the overall quality of the fit across all (fitted) strikes, relative to the error bars of the implied vols (from the bid-ask spread, say); the latter is a measure of the absolute match between fit and market around ATM.

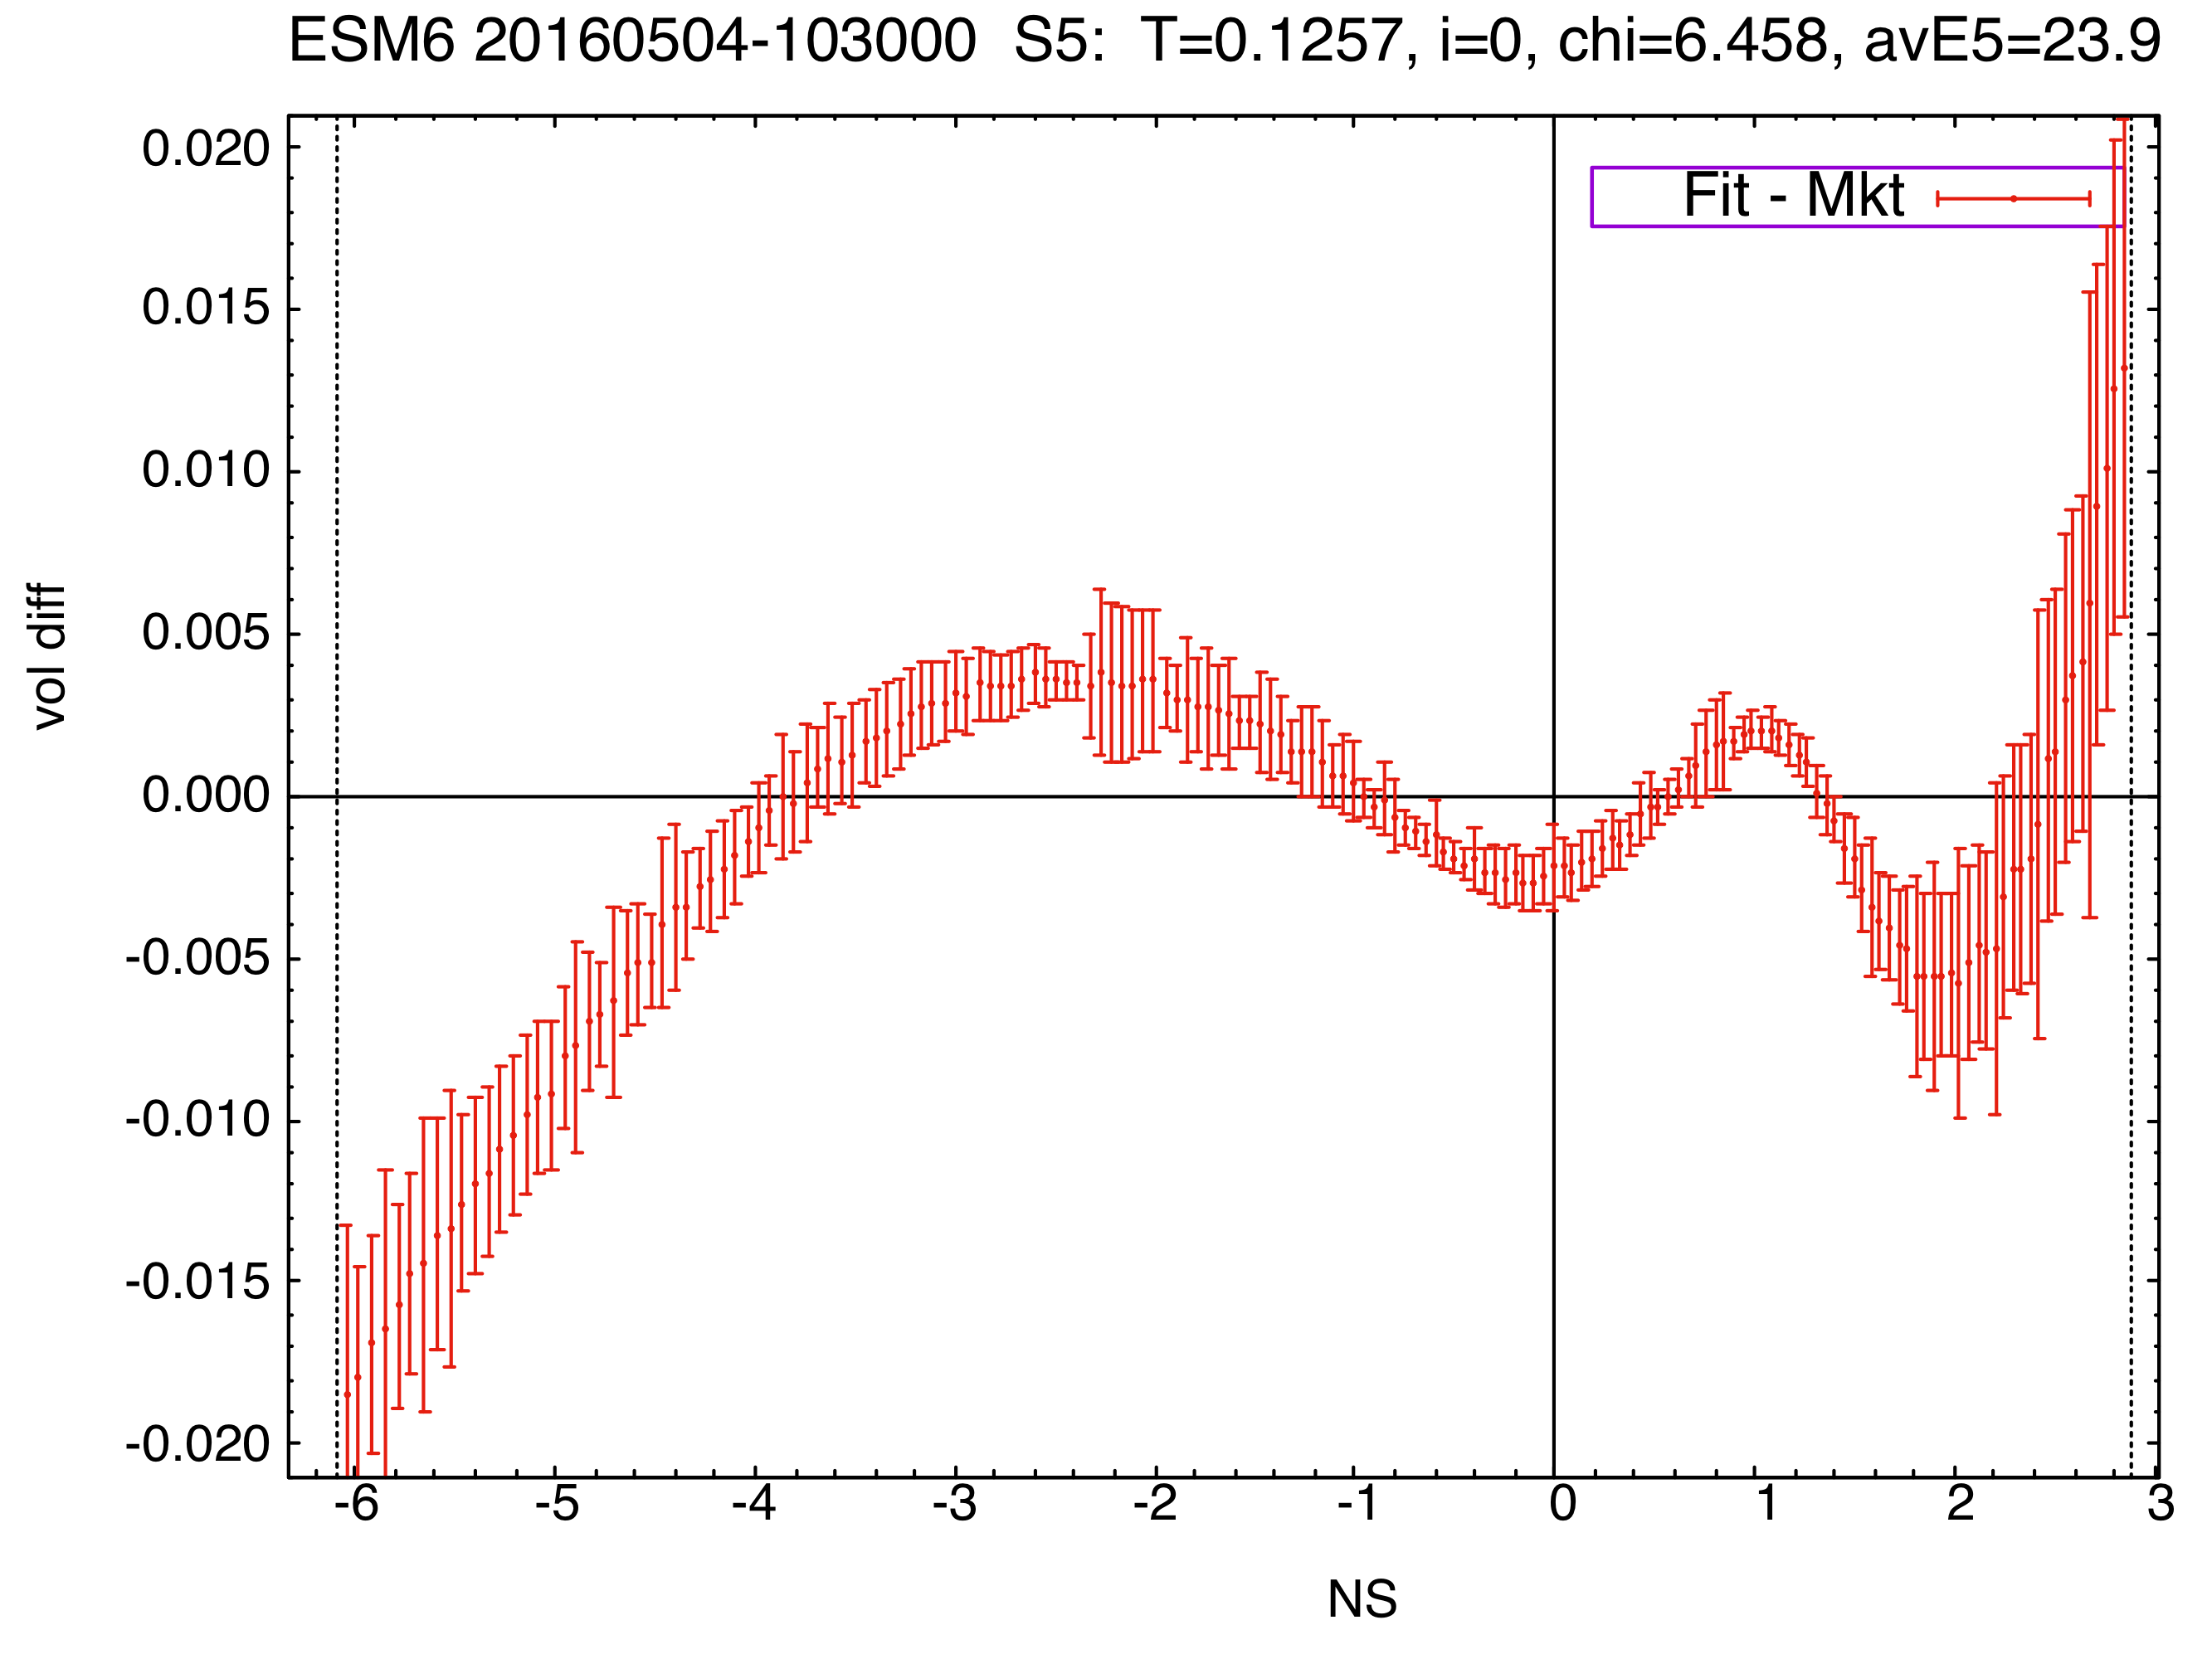
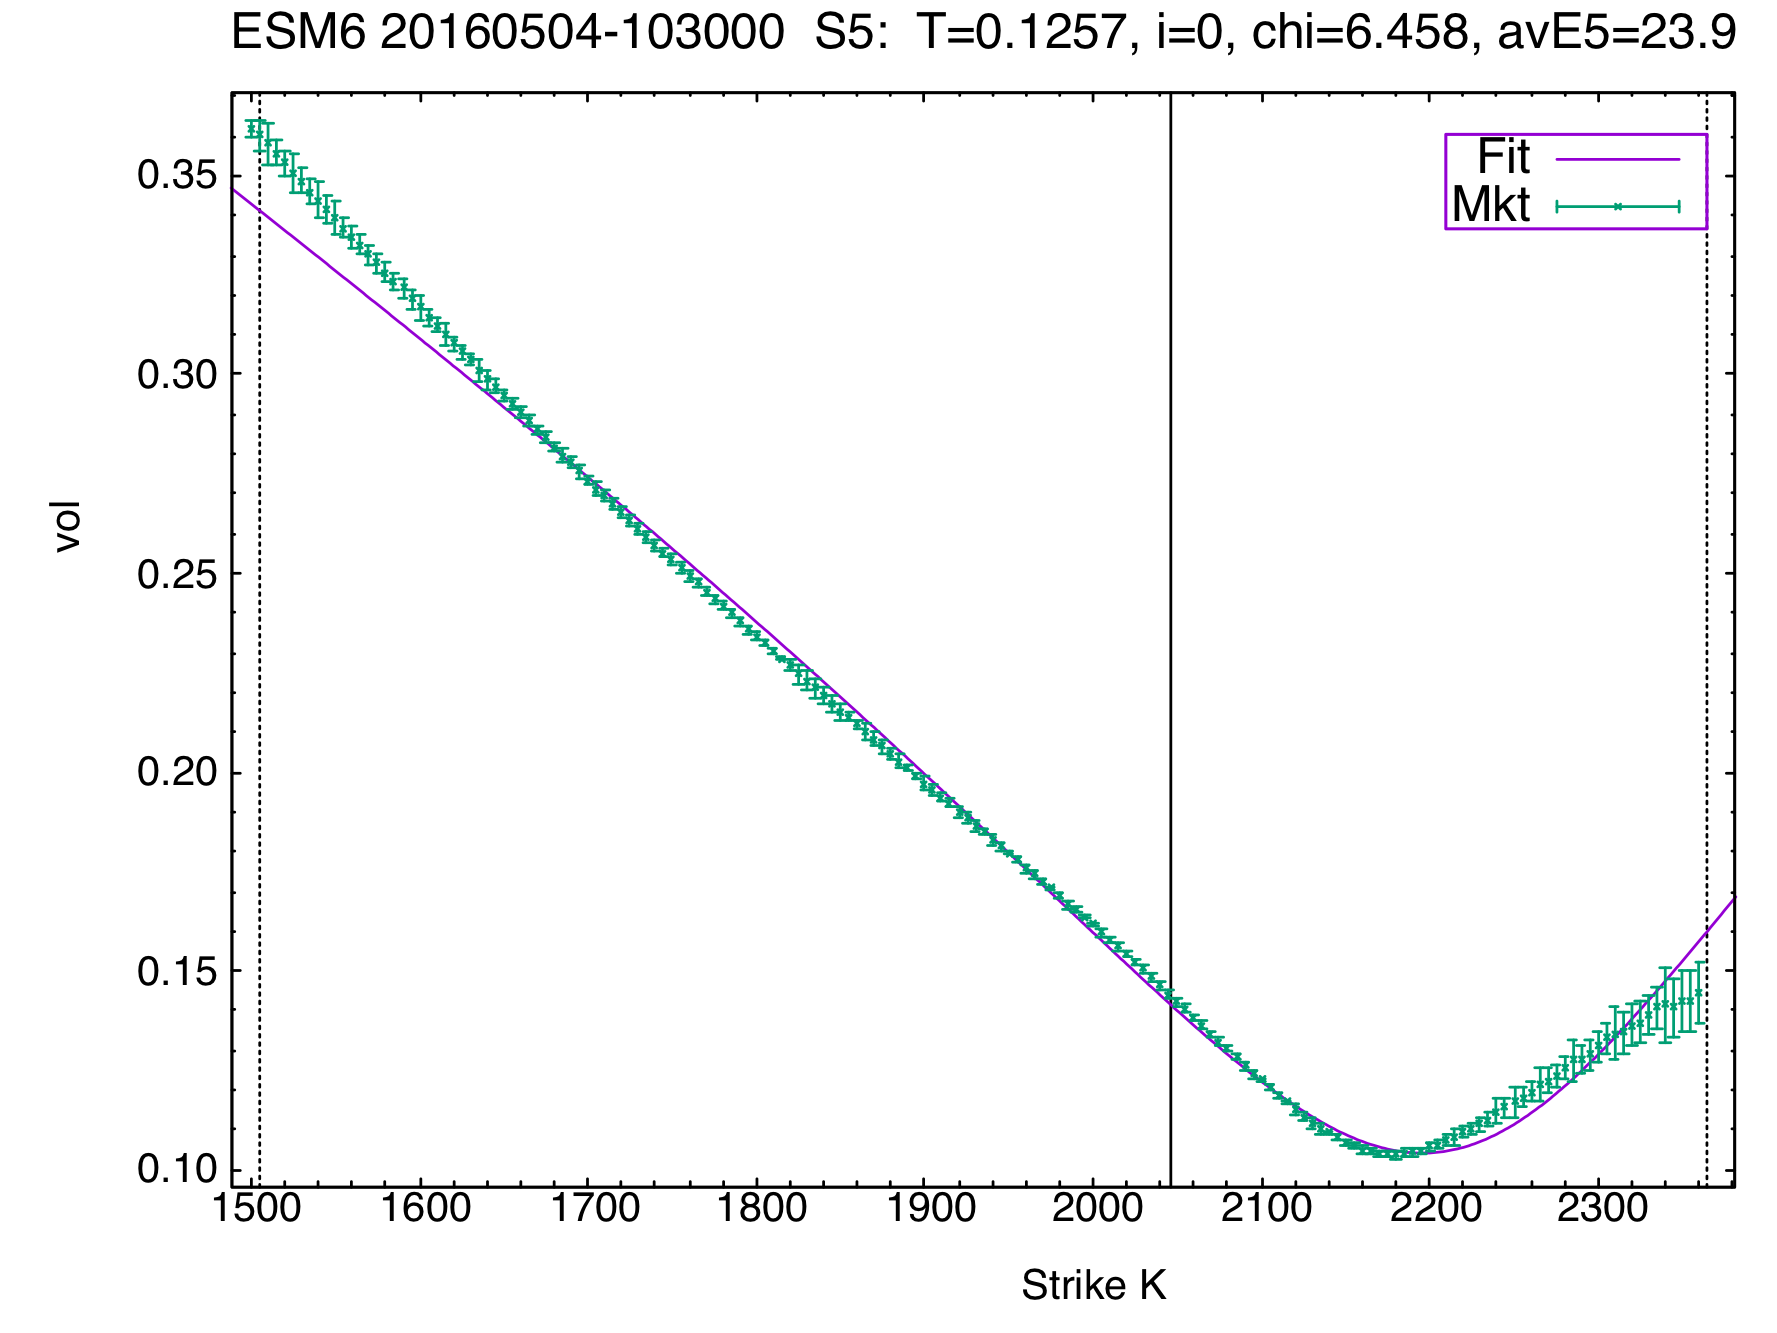
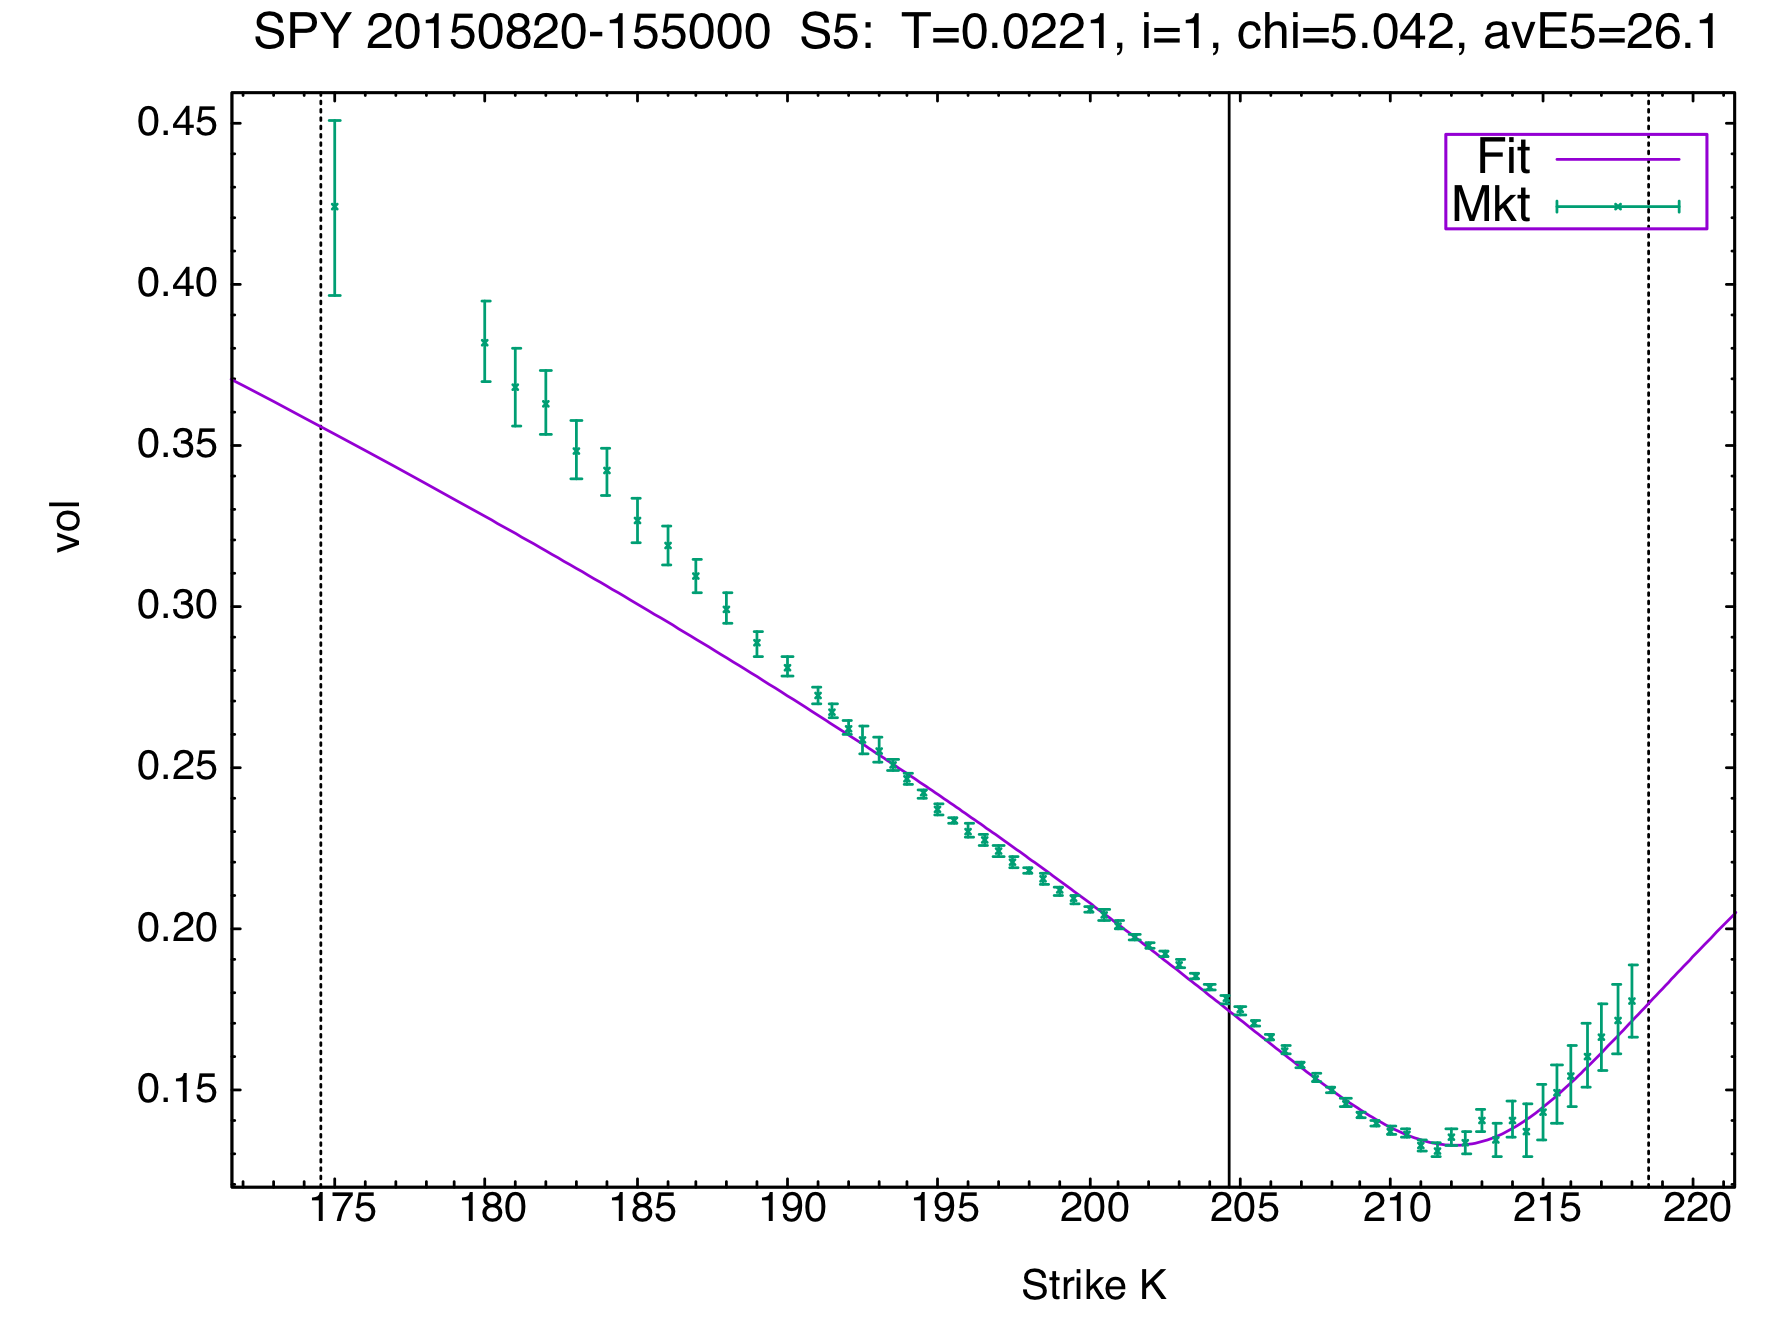
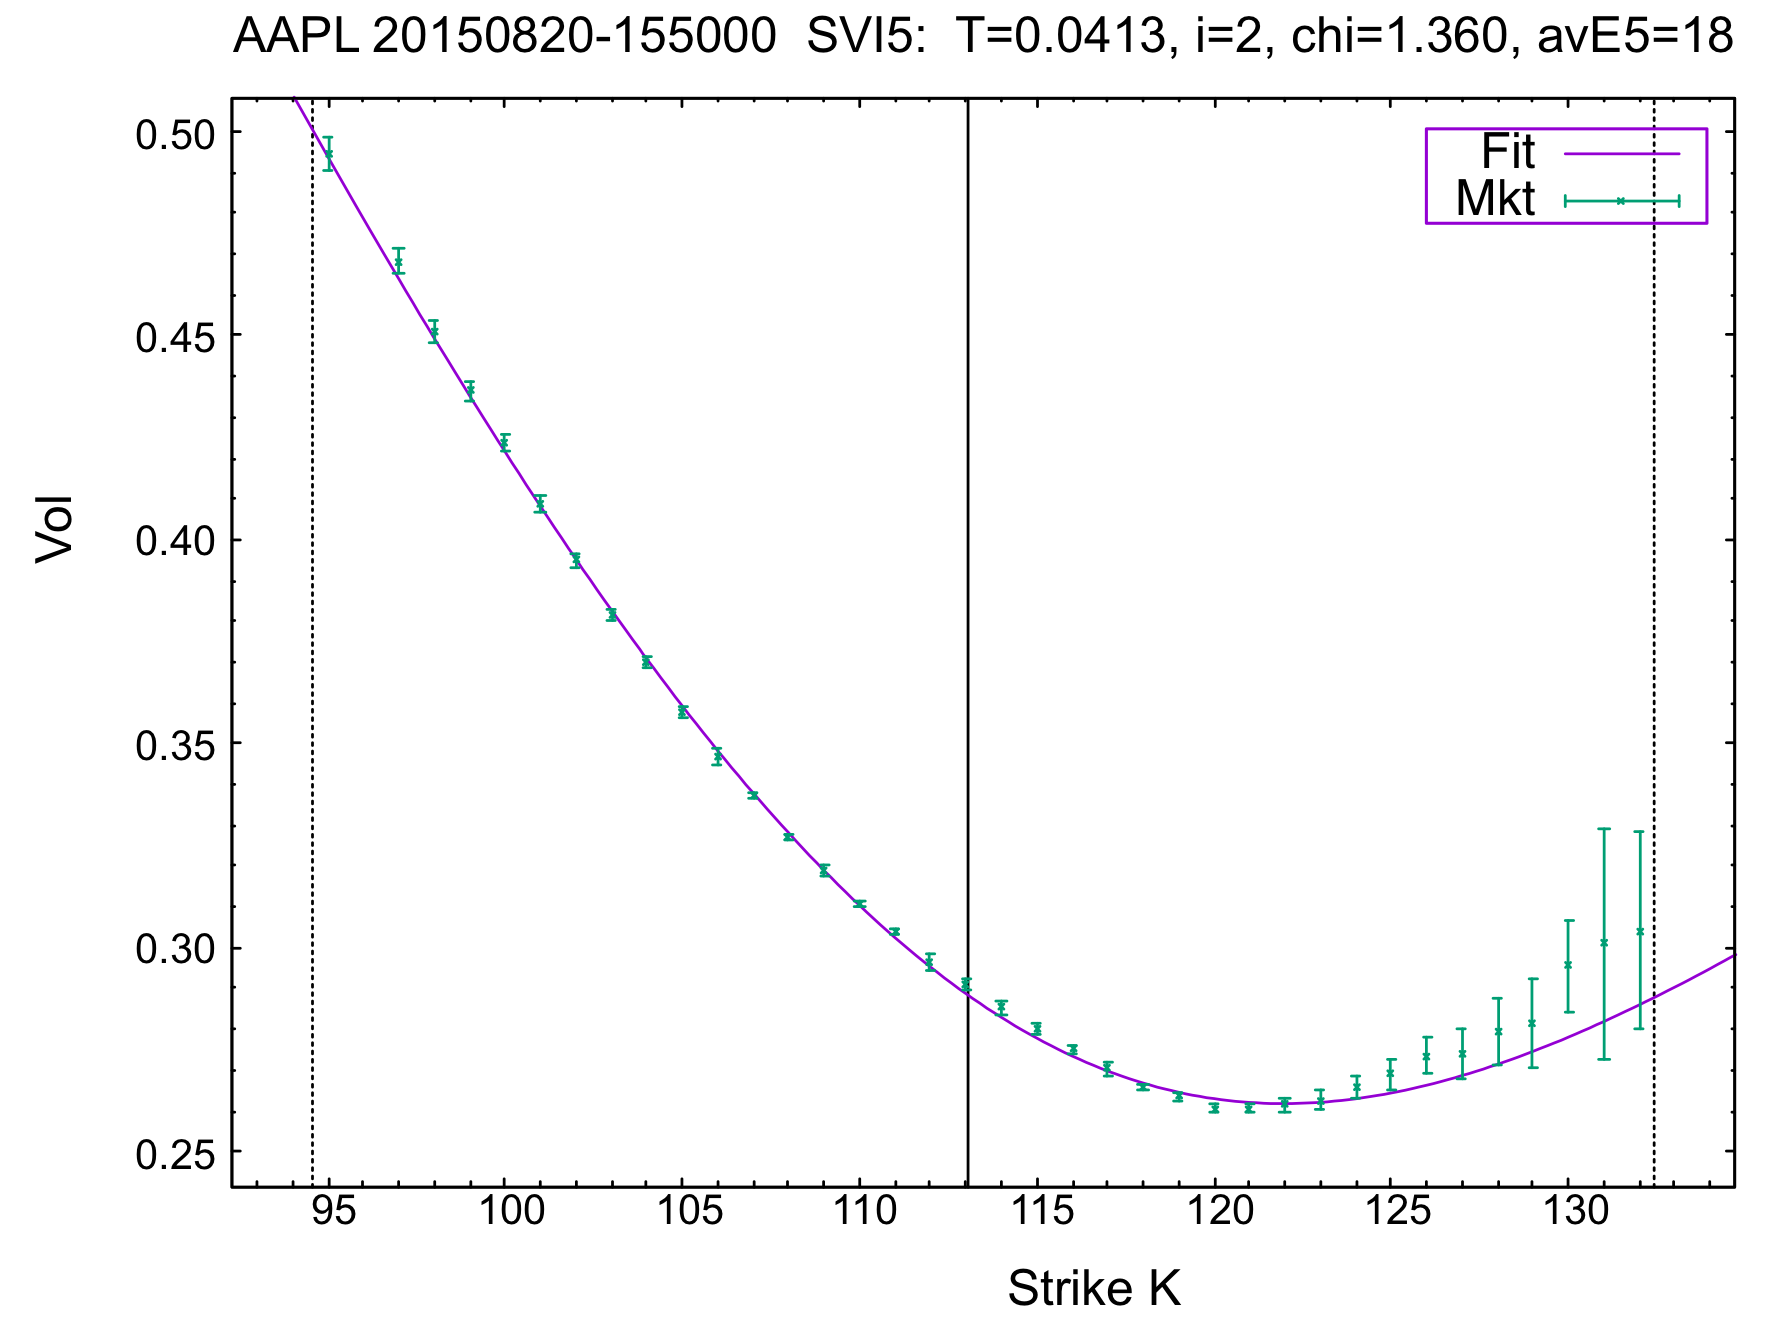
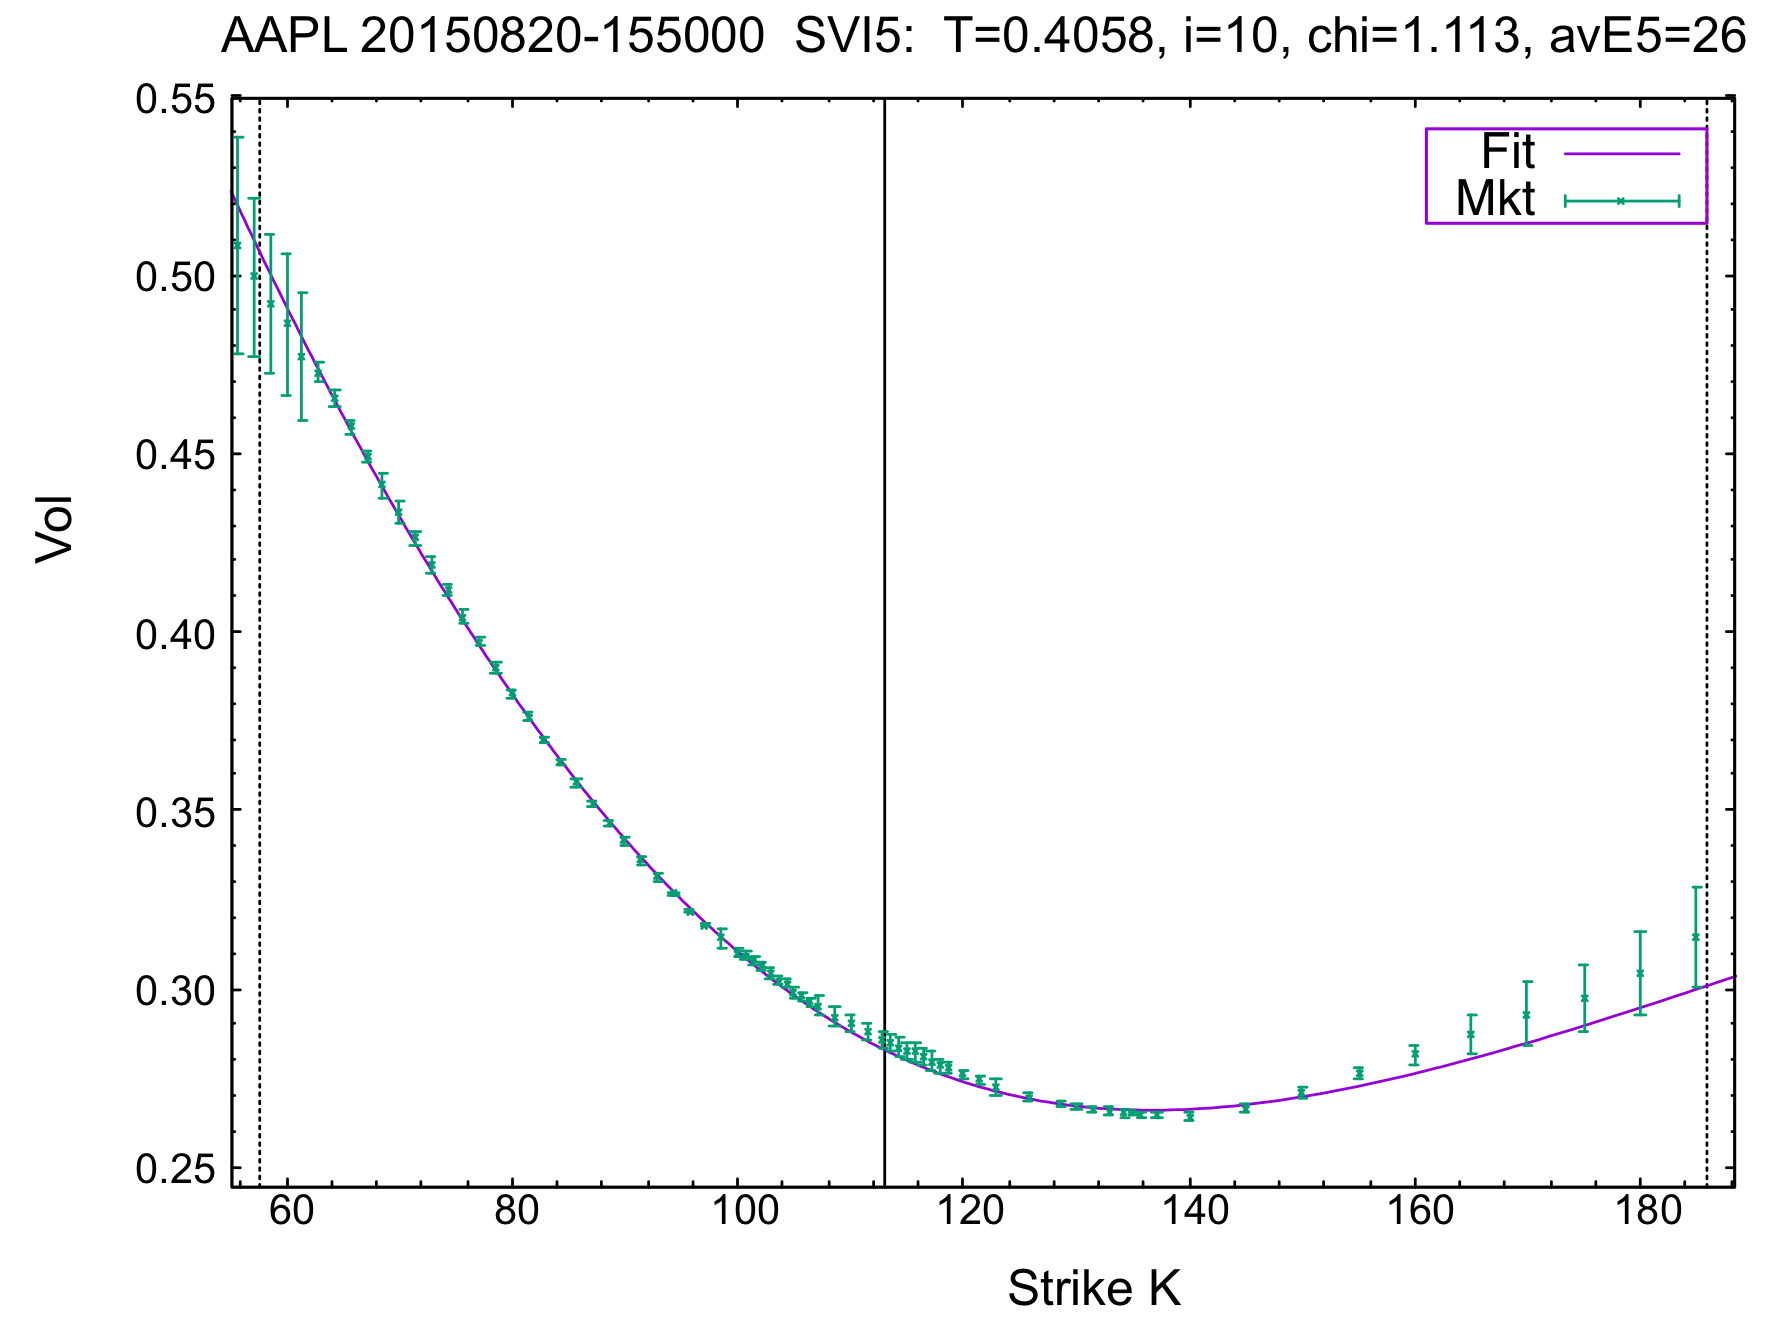
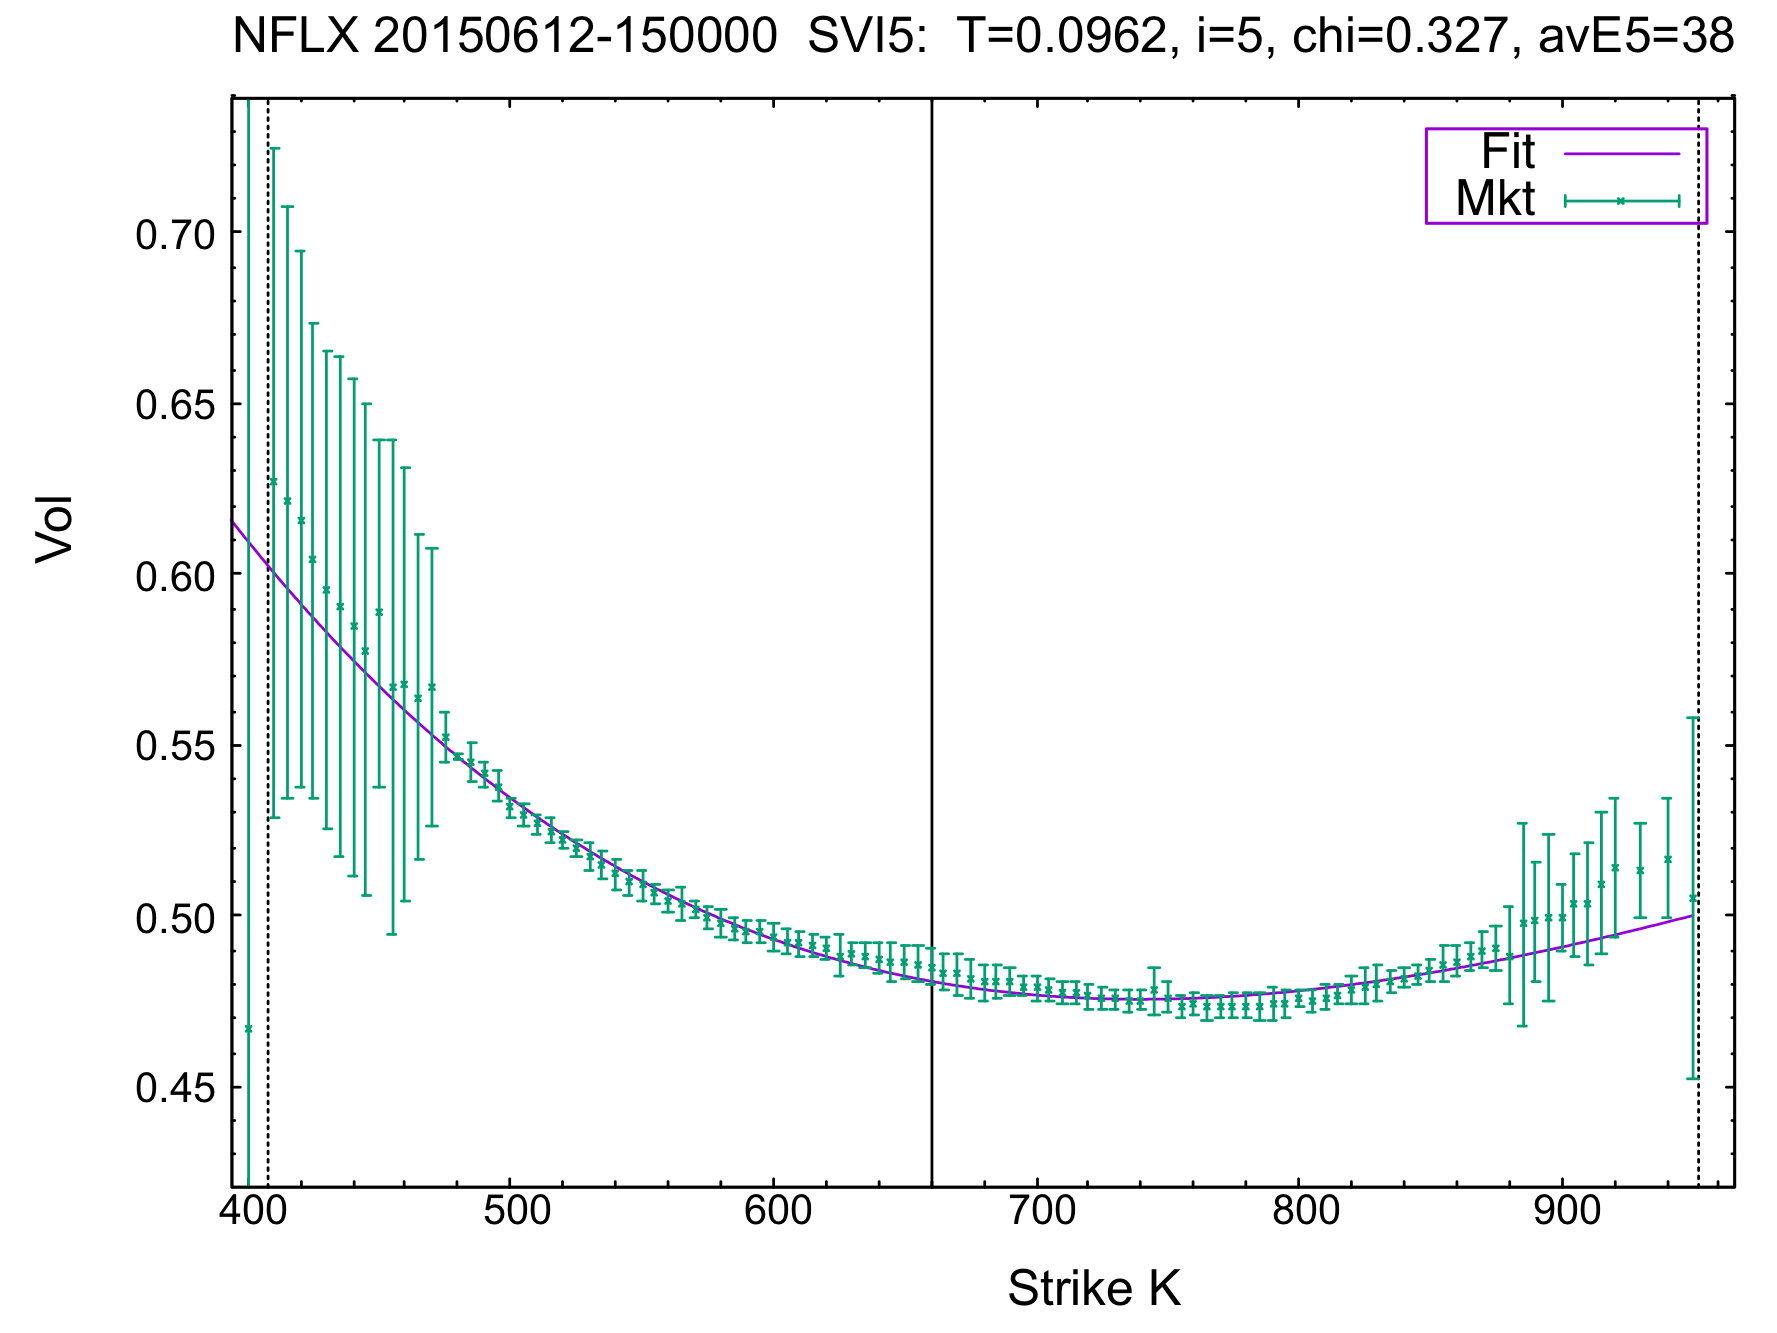
The vol difference plot clearly shows that the SVI (aka S5) parameterization does not manage to capture the vol shape properly; the fit is clearly biased. The same fact is clear from the metrics. The fit has a very bad chi=6.458, and avE5=24bps.
We need something better.
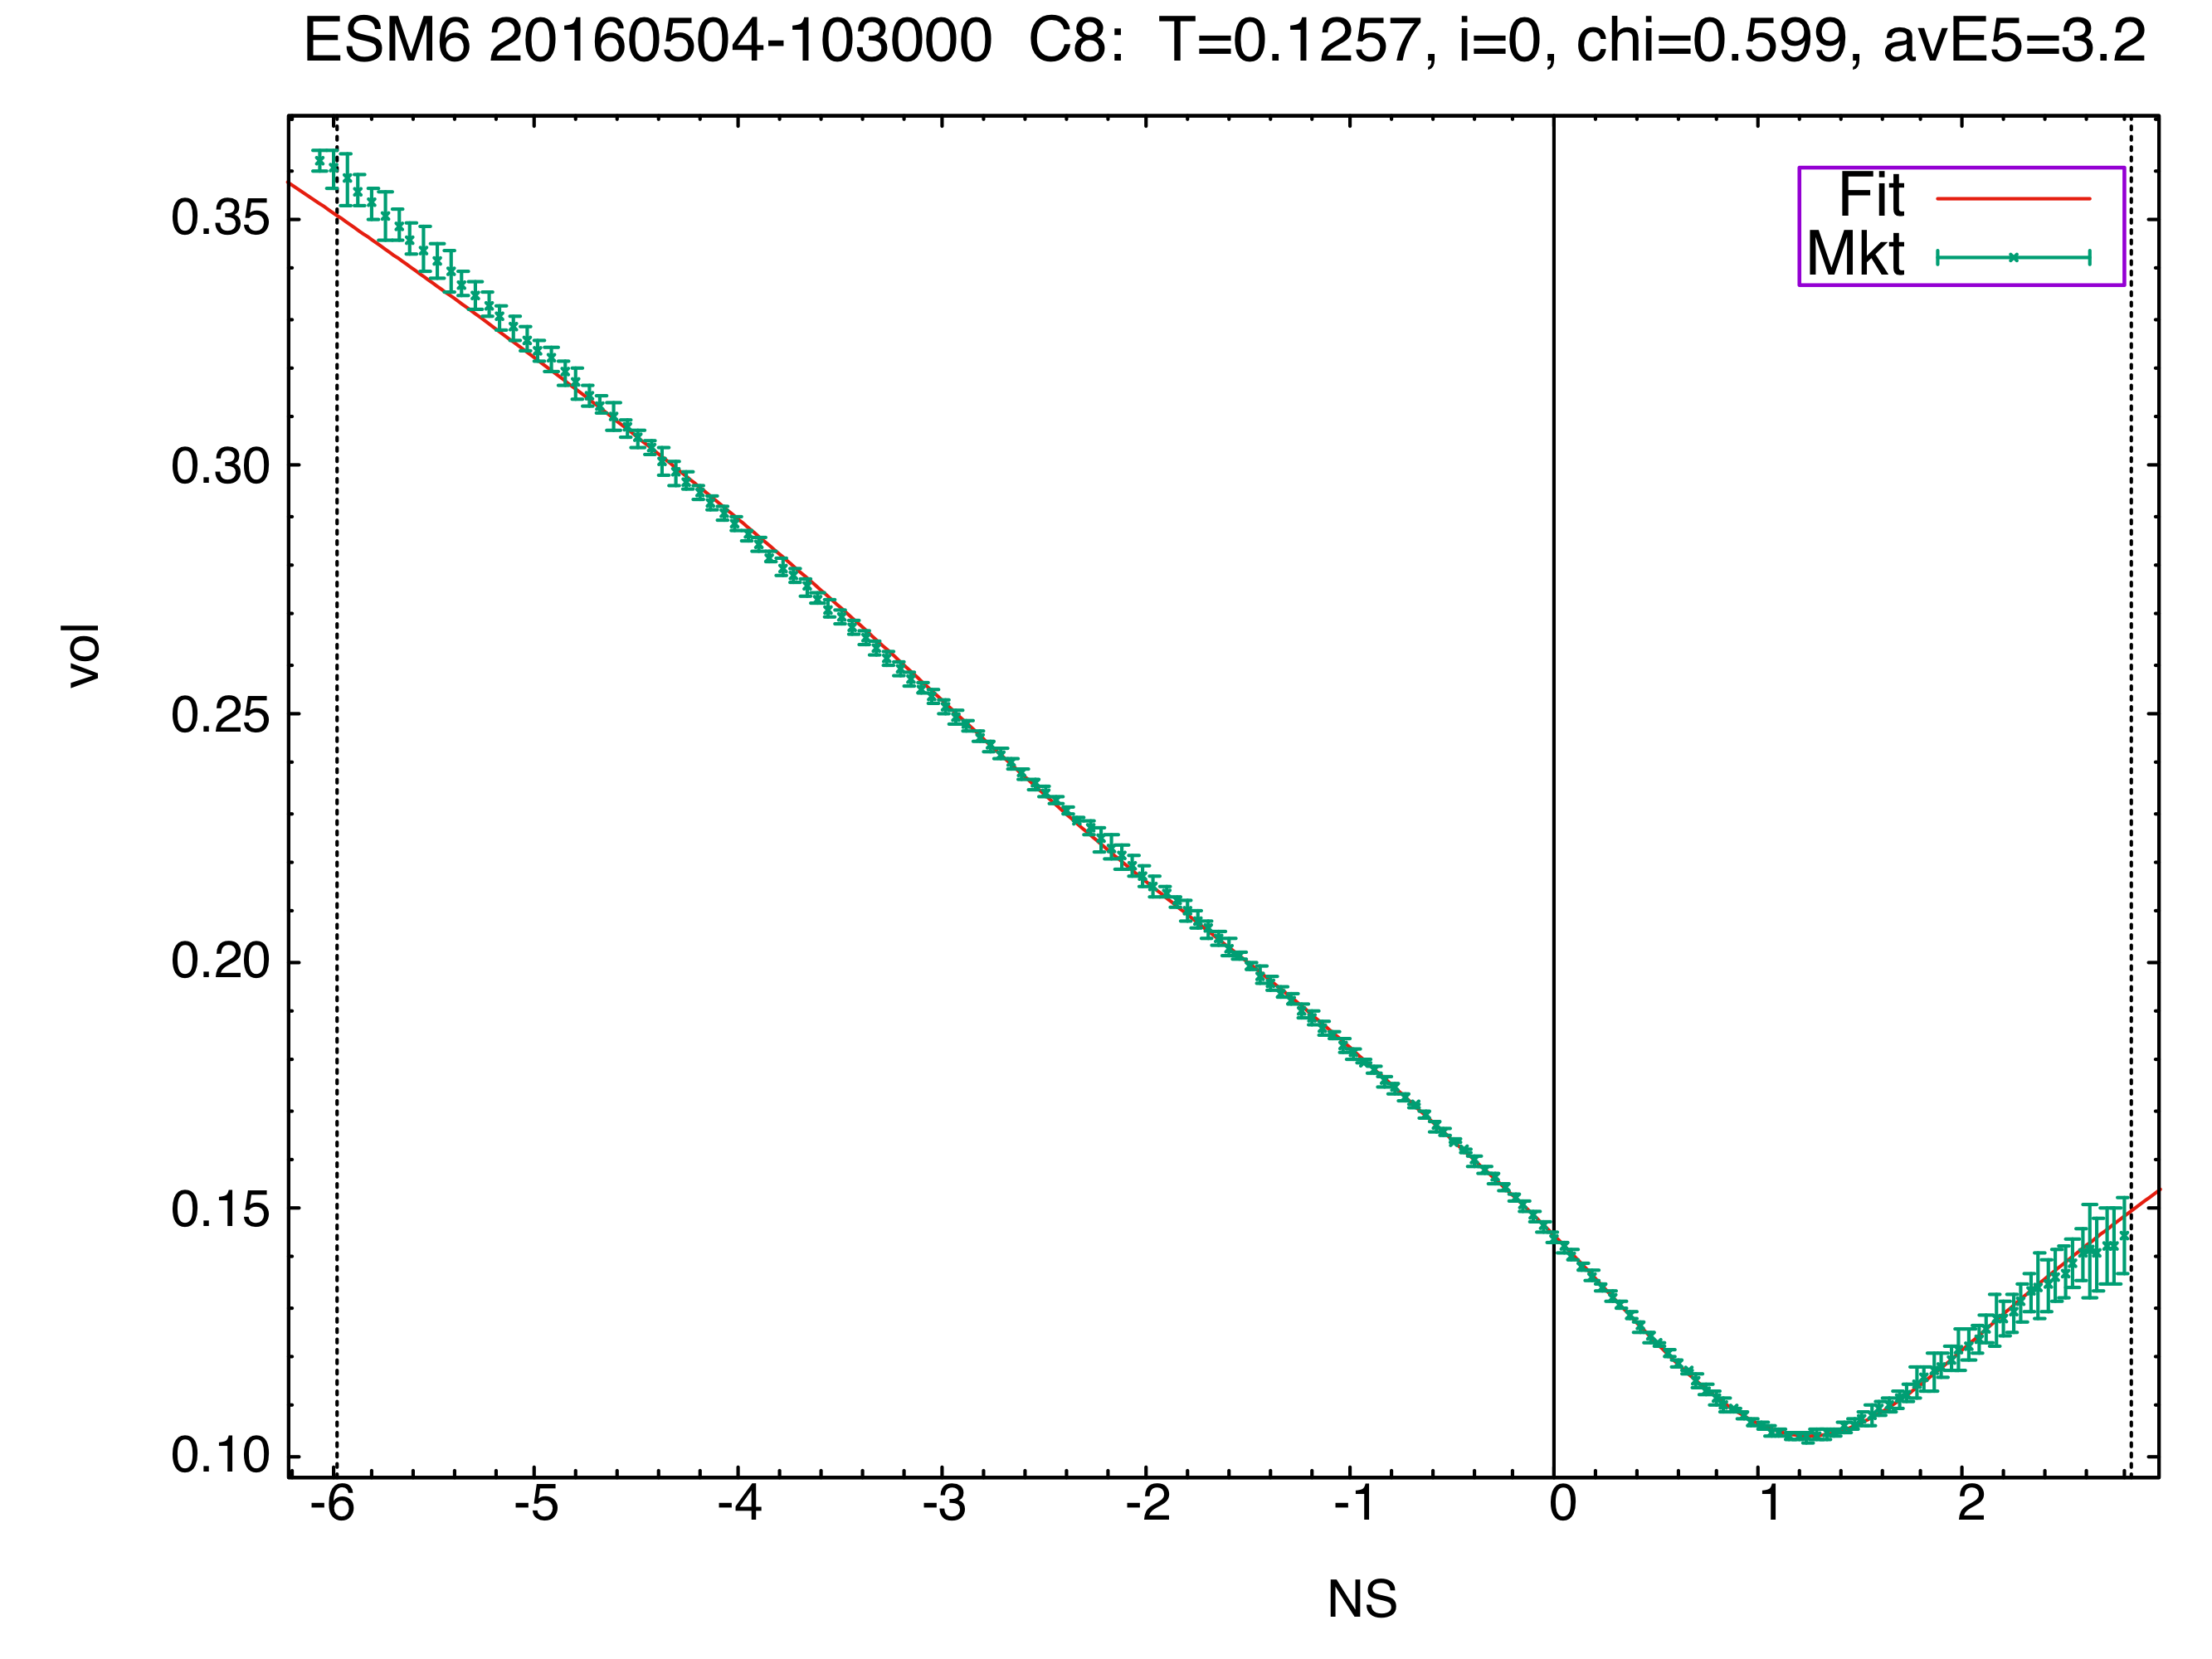
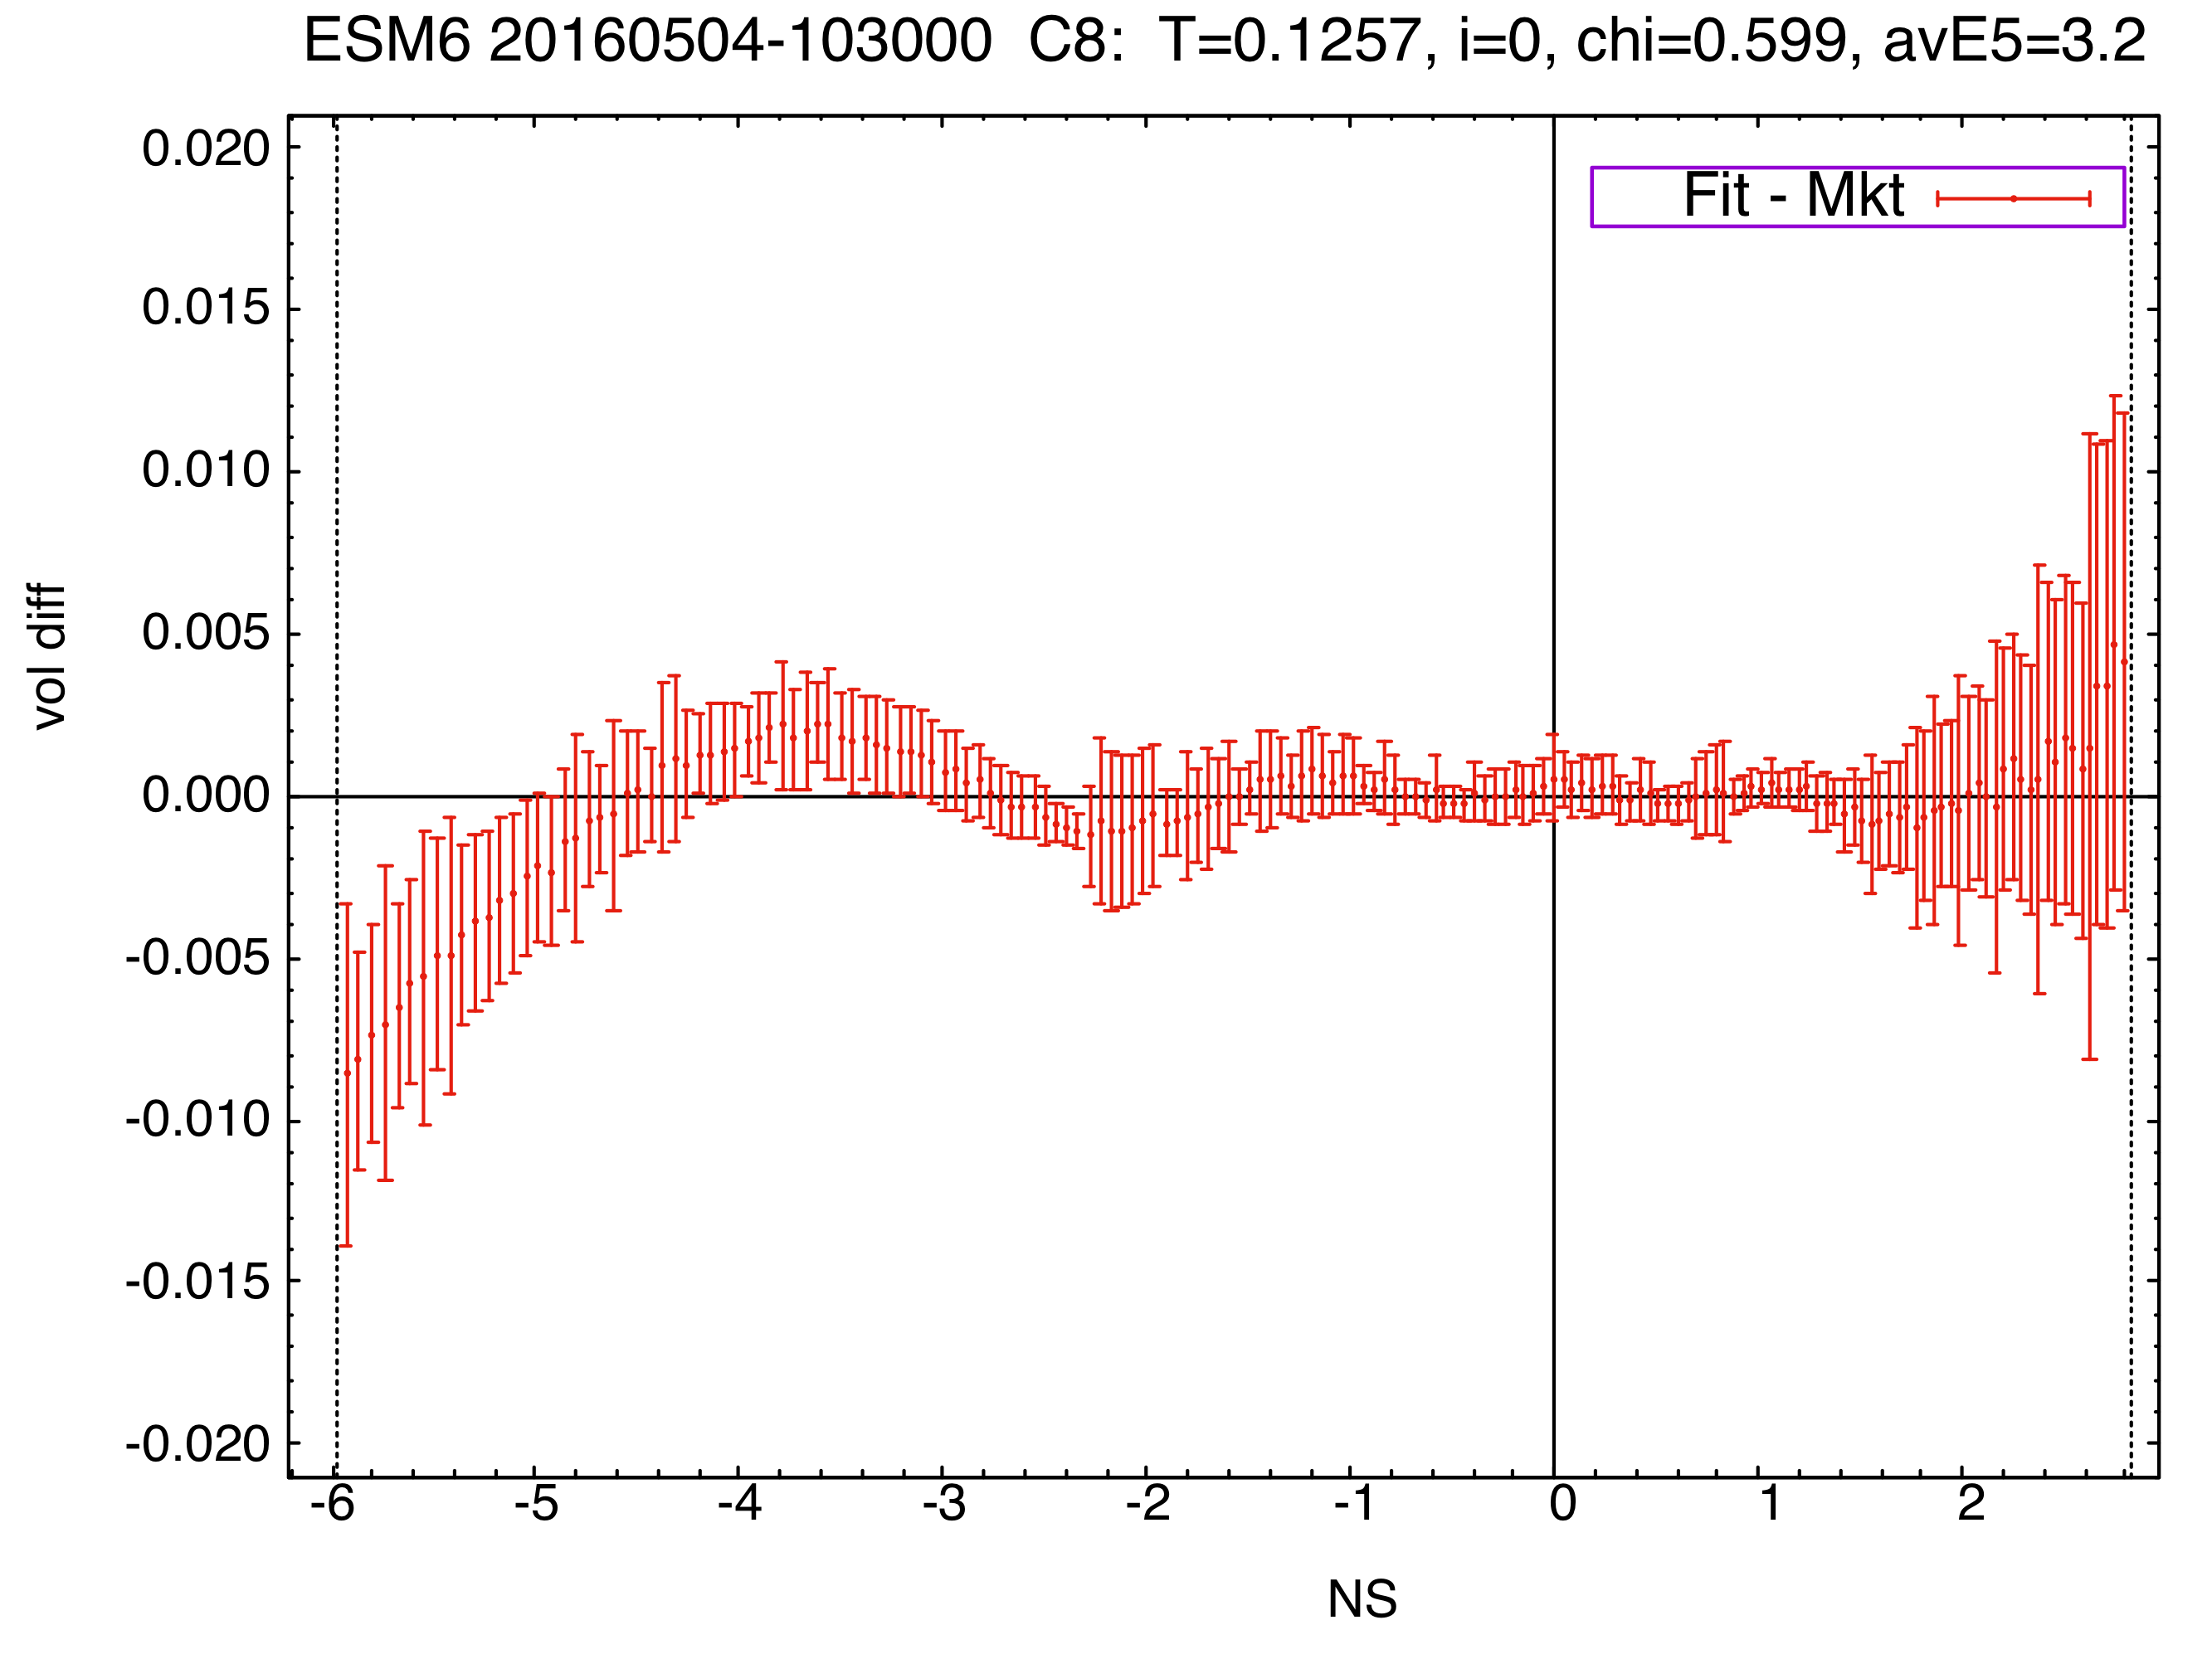
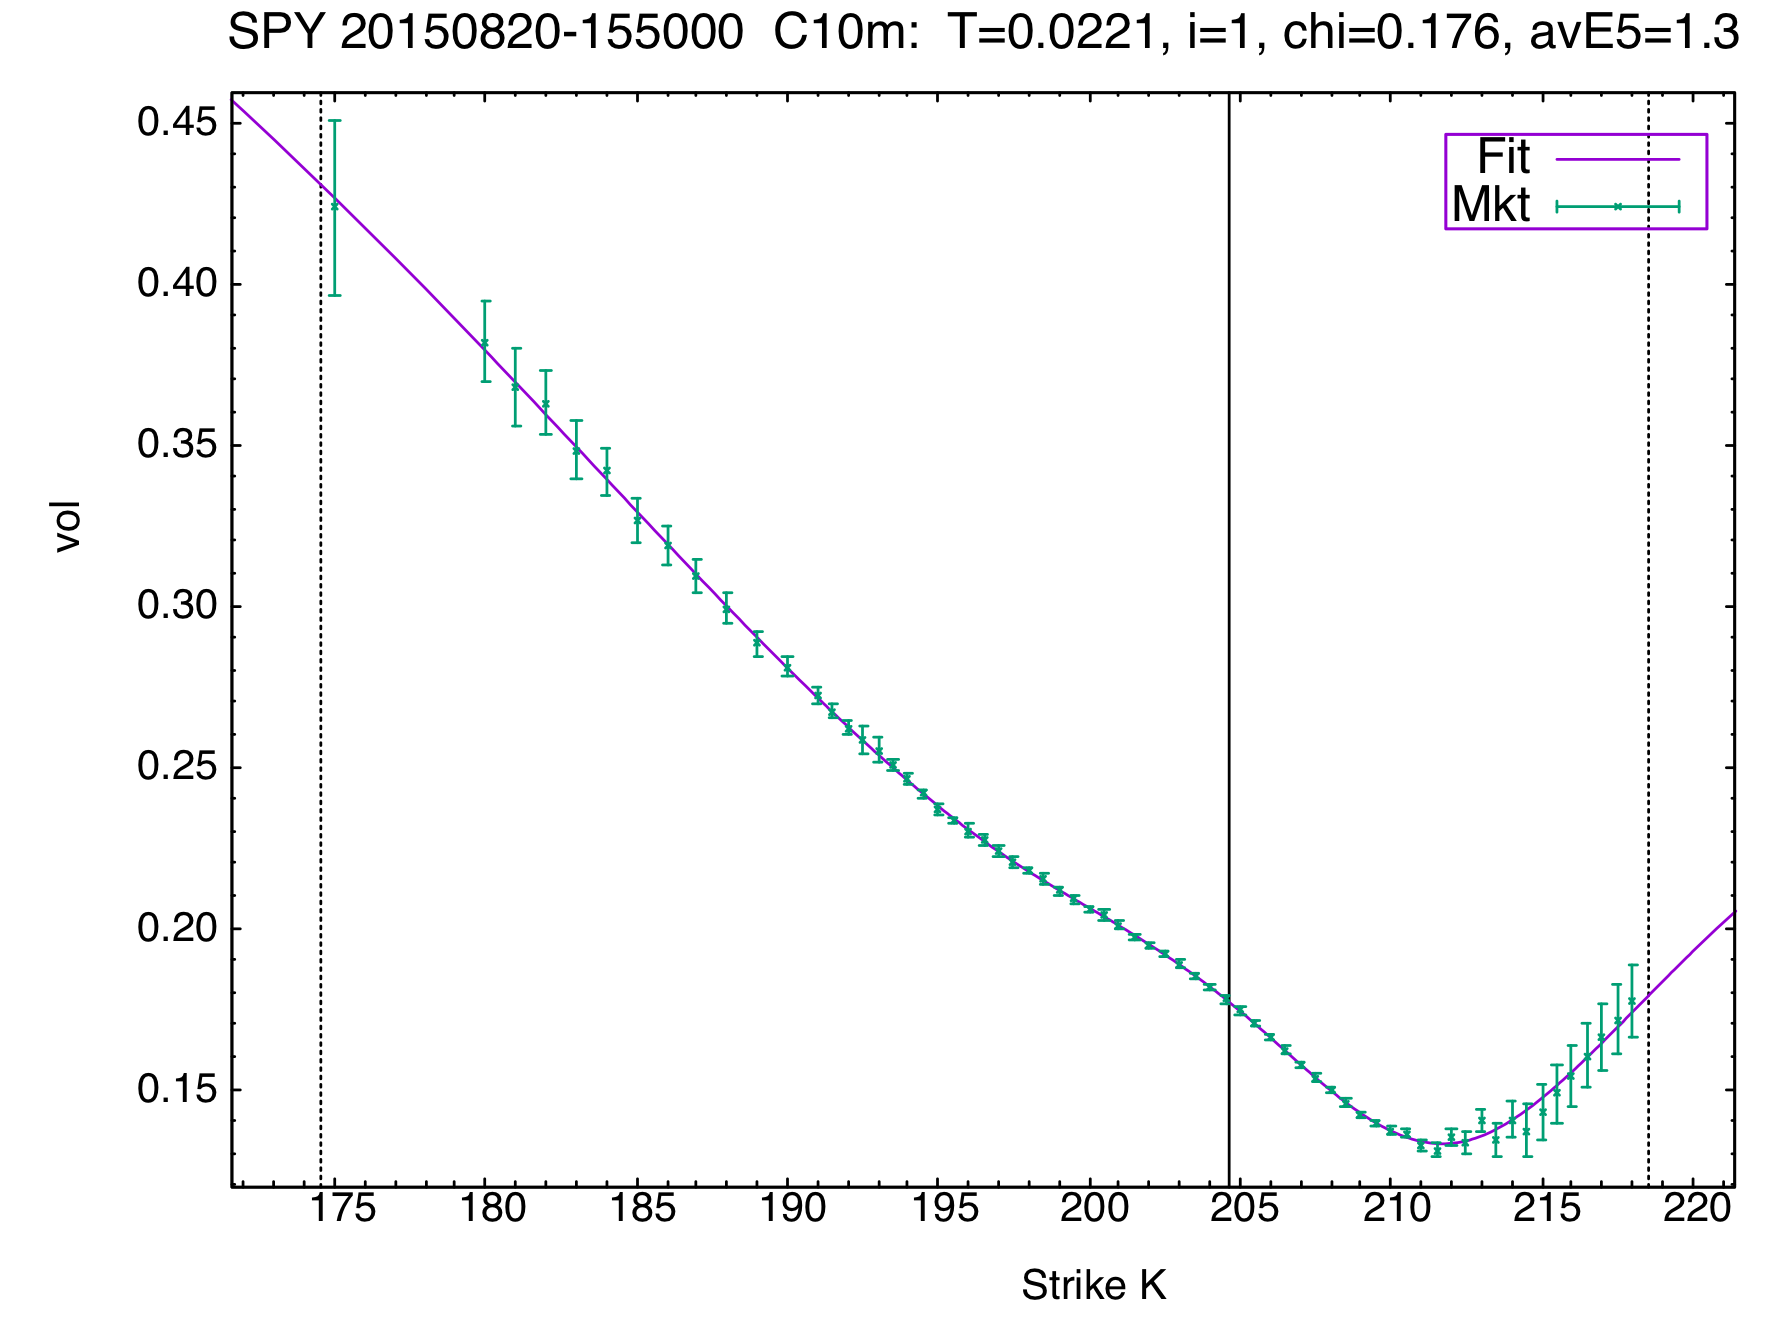
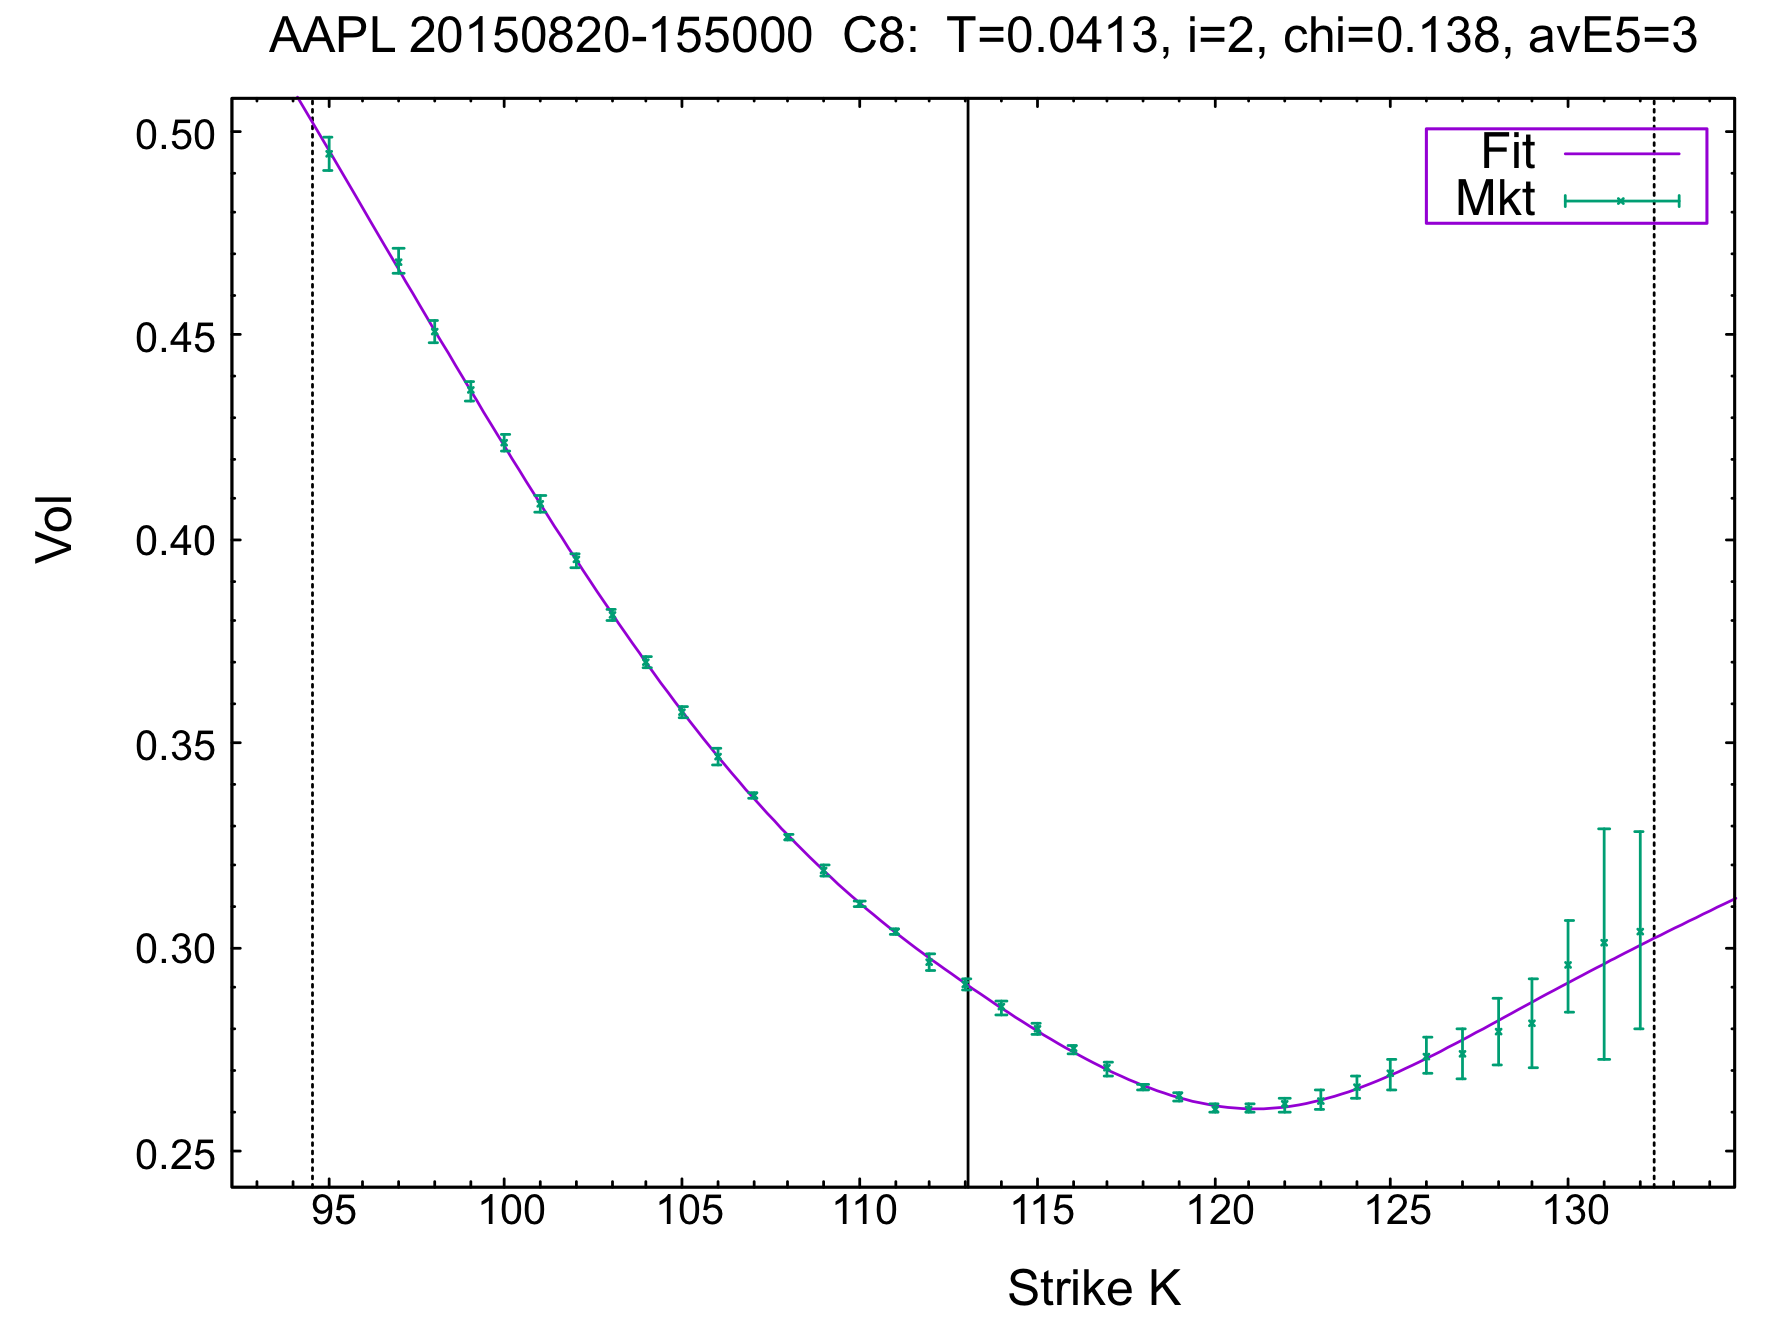
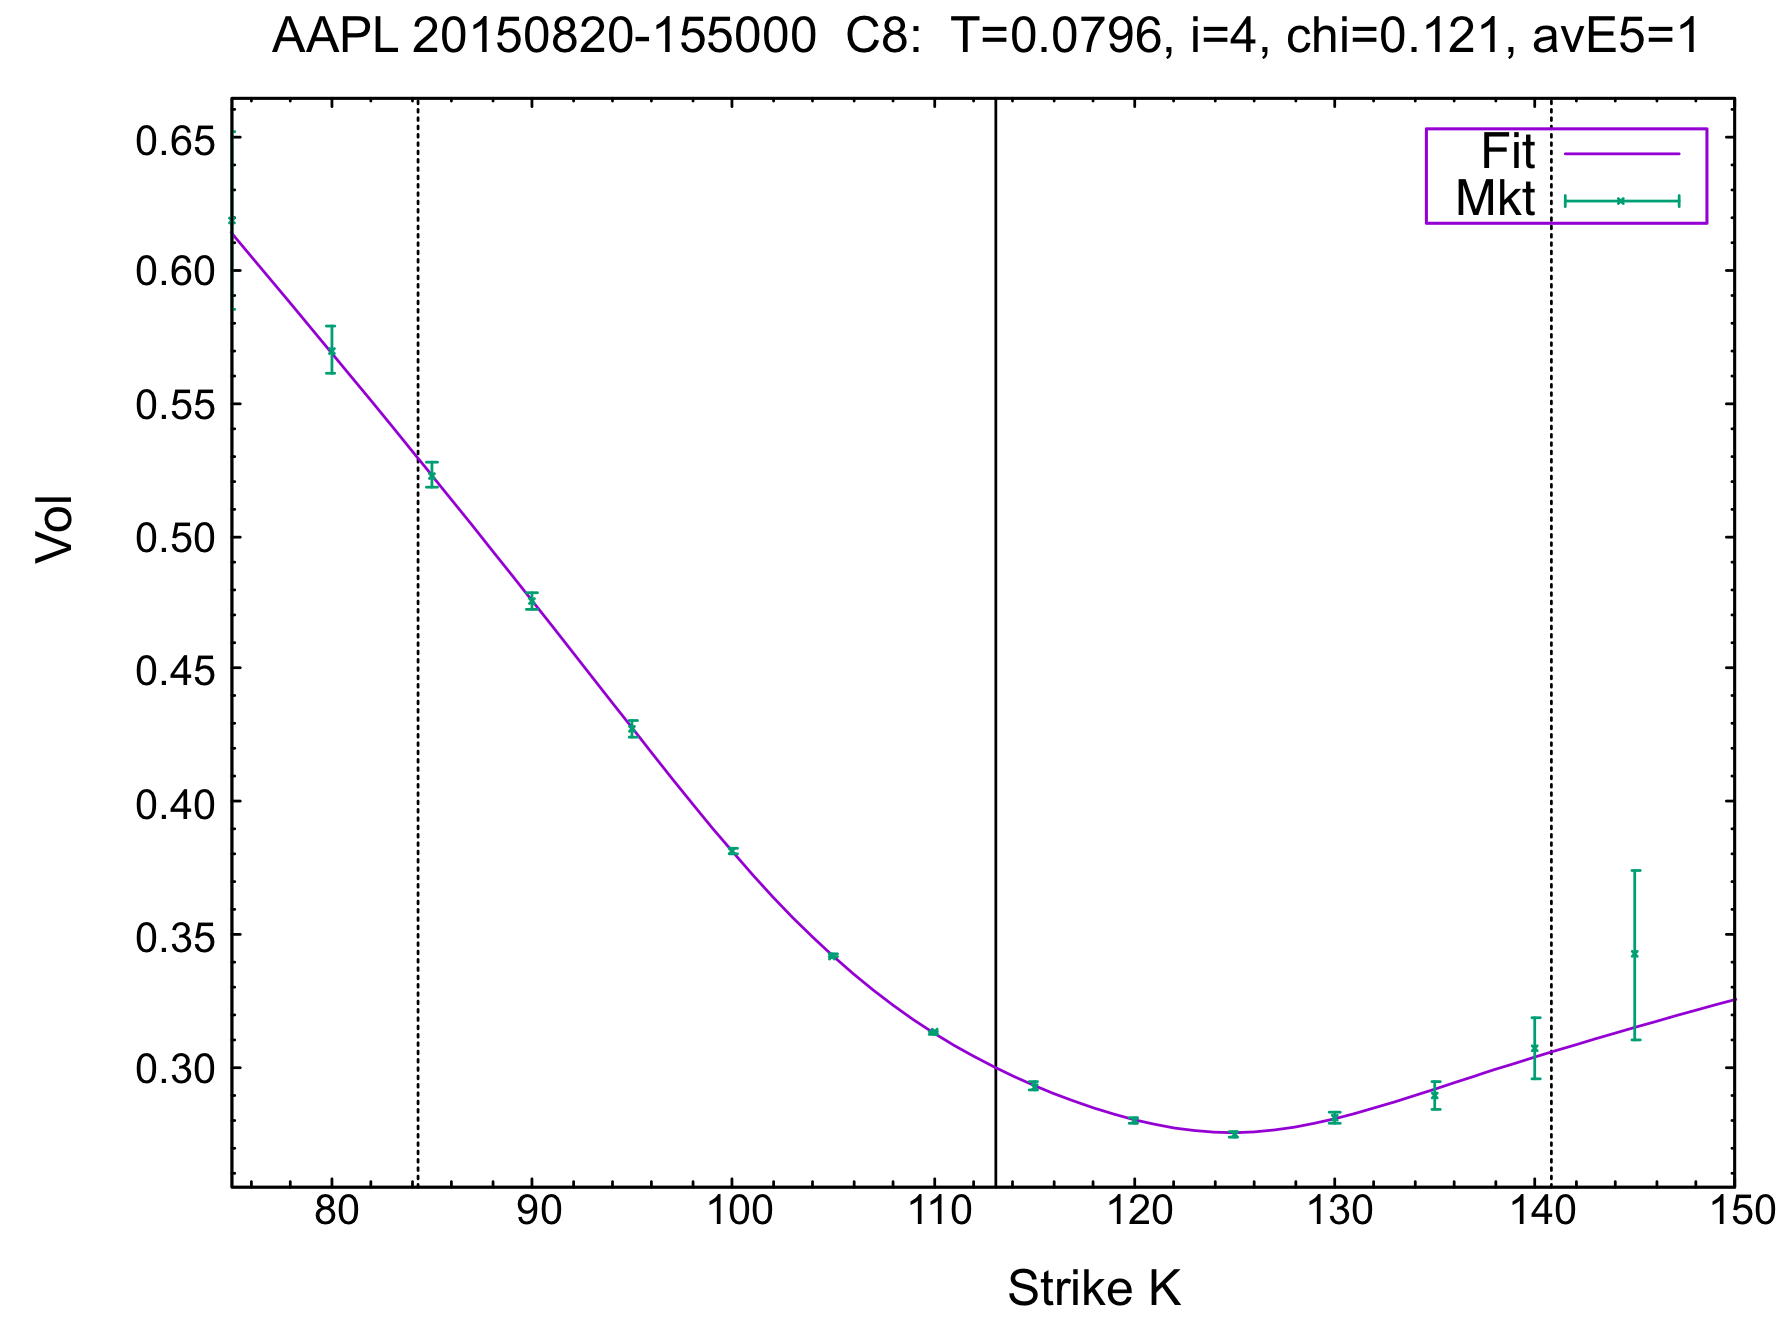
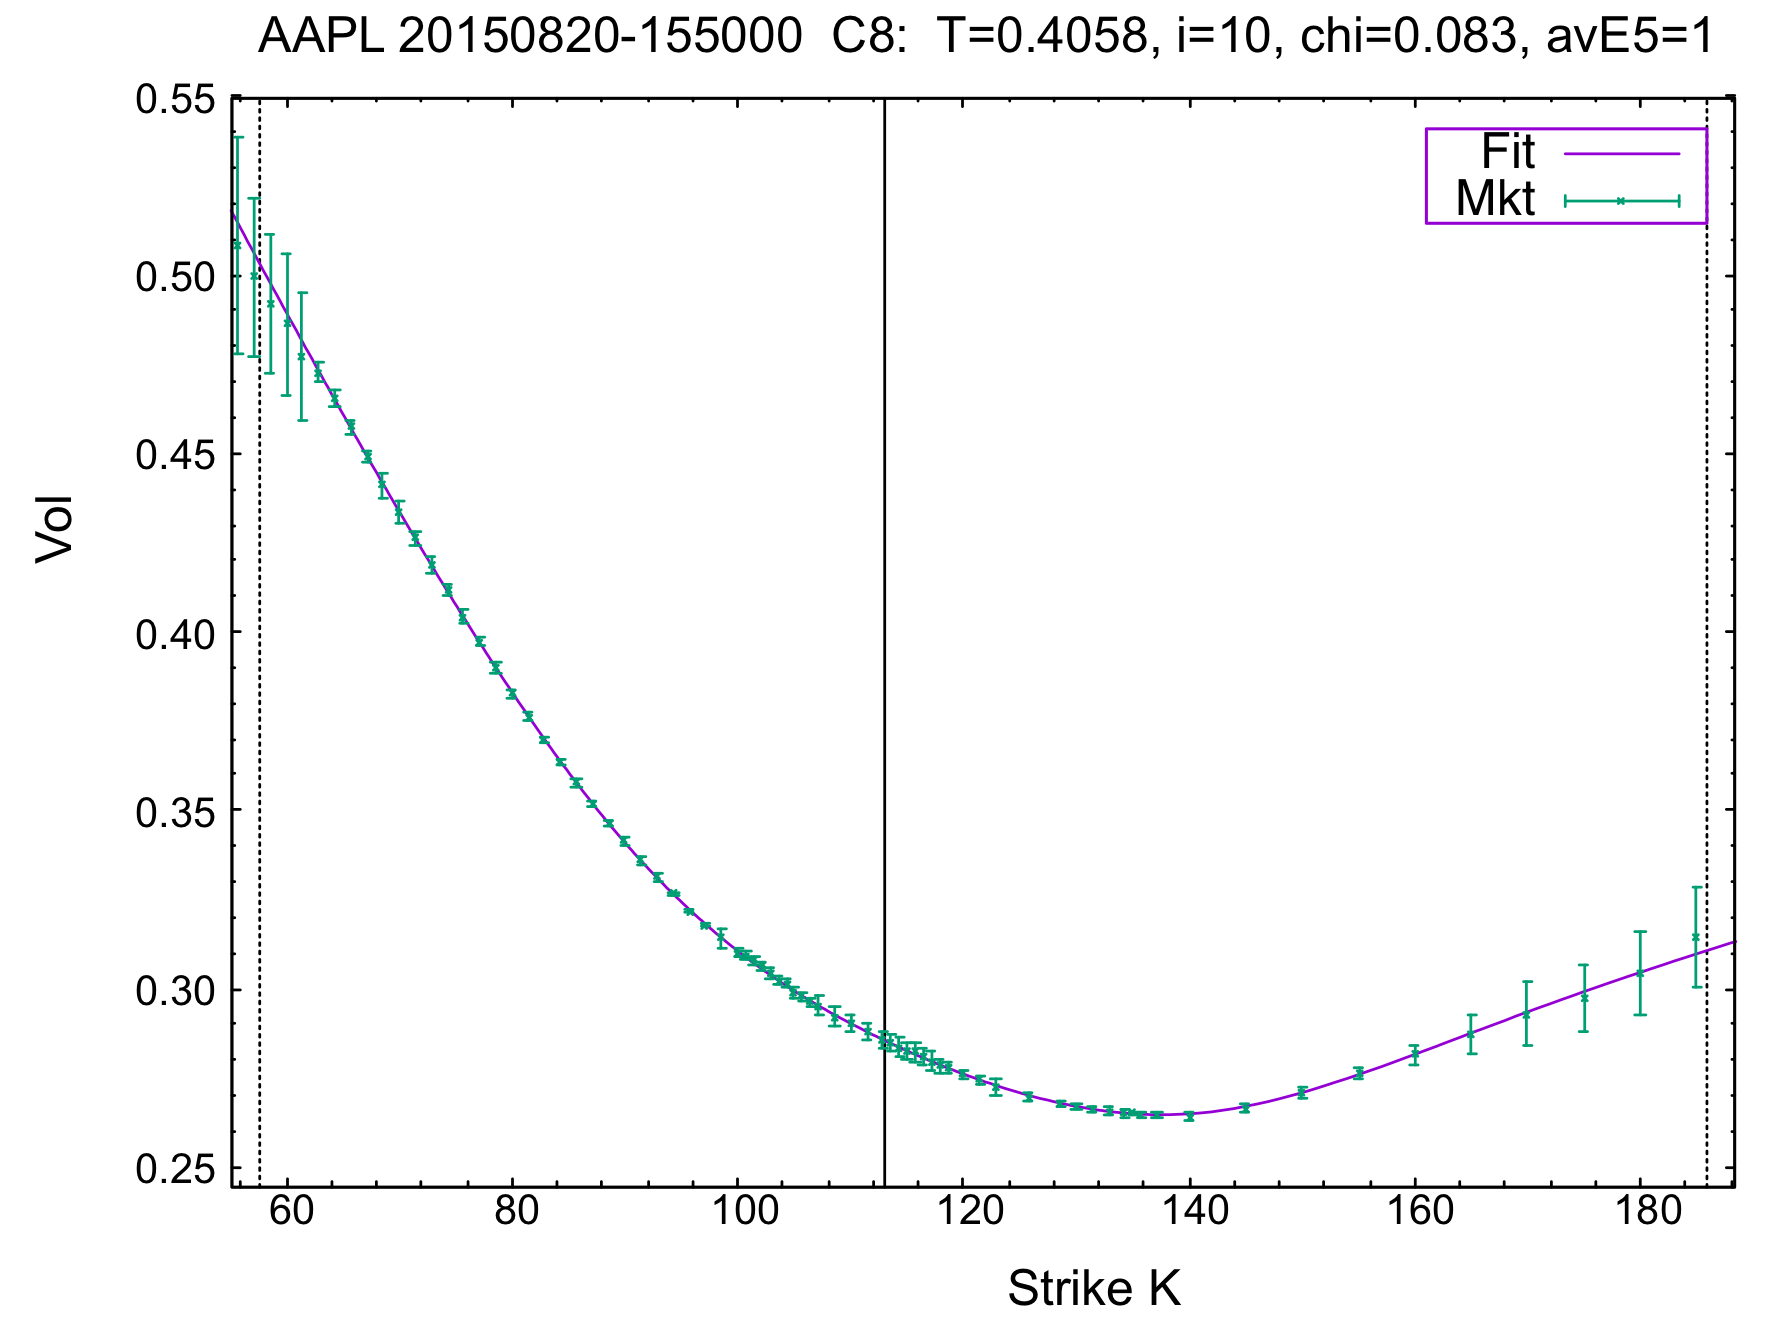
Here we use our C8 curve to fit the data. It is clearly much better at capturing the vol shape. Note that chi=0.599, which is a factor of 10 better than the SVI curve; avE5 improved by a factor of 8. But there still is significant bias in the fitted curve.
We can do better.
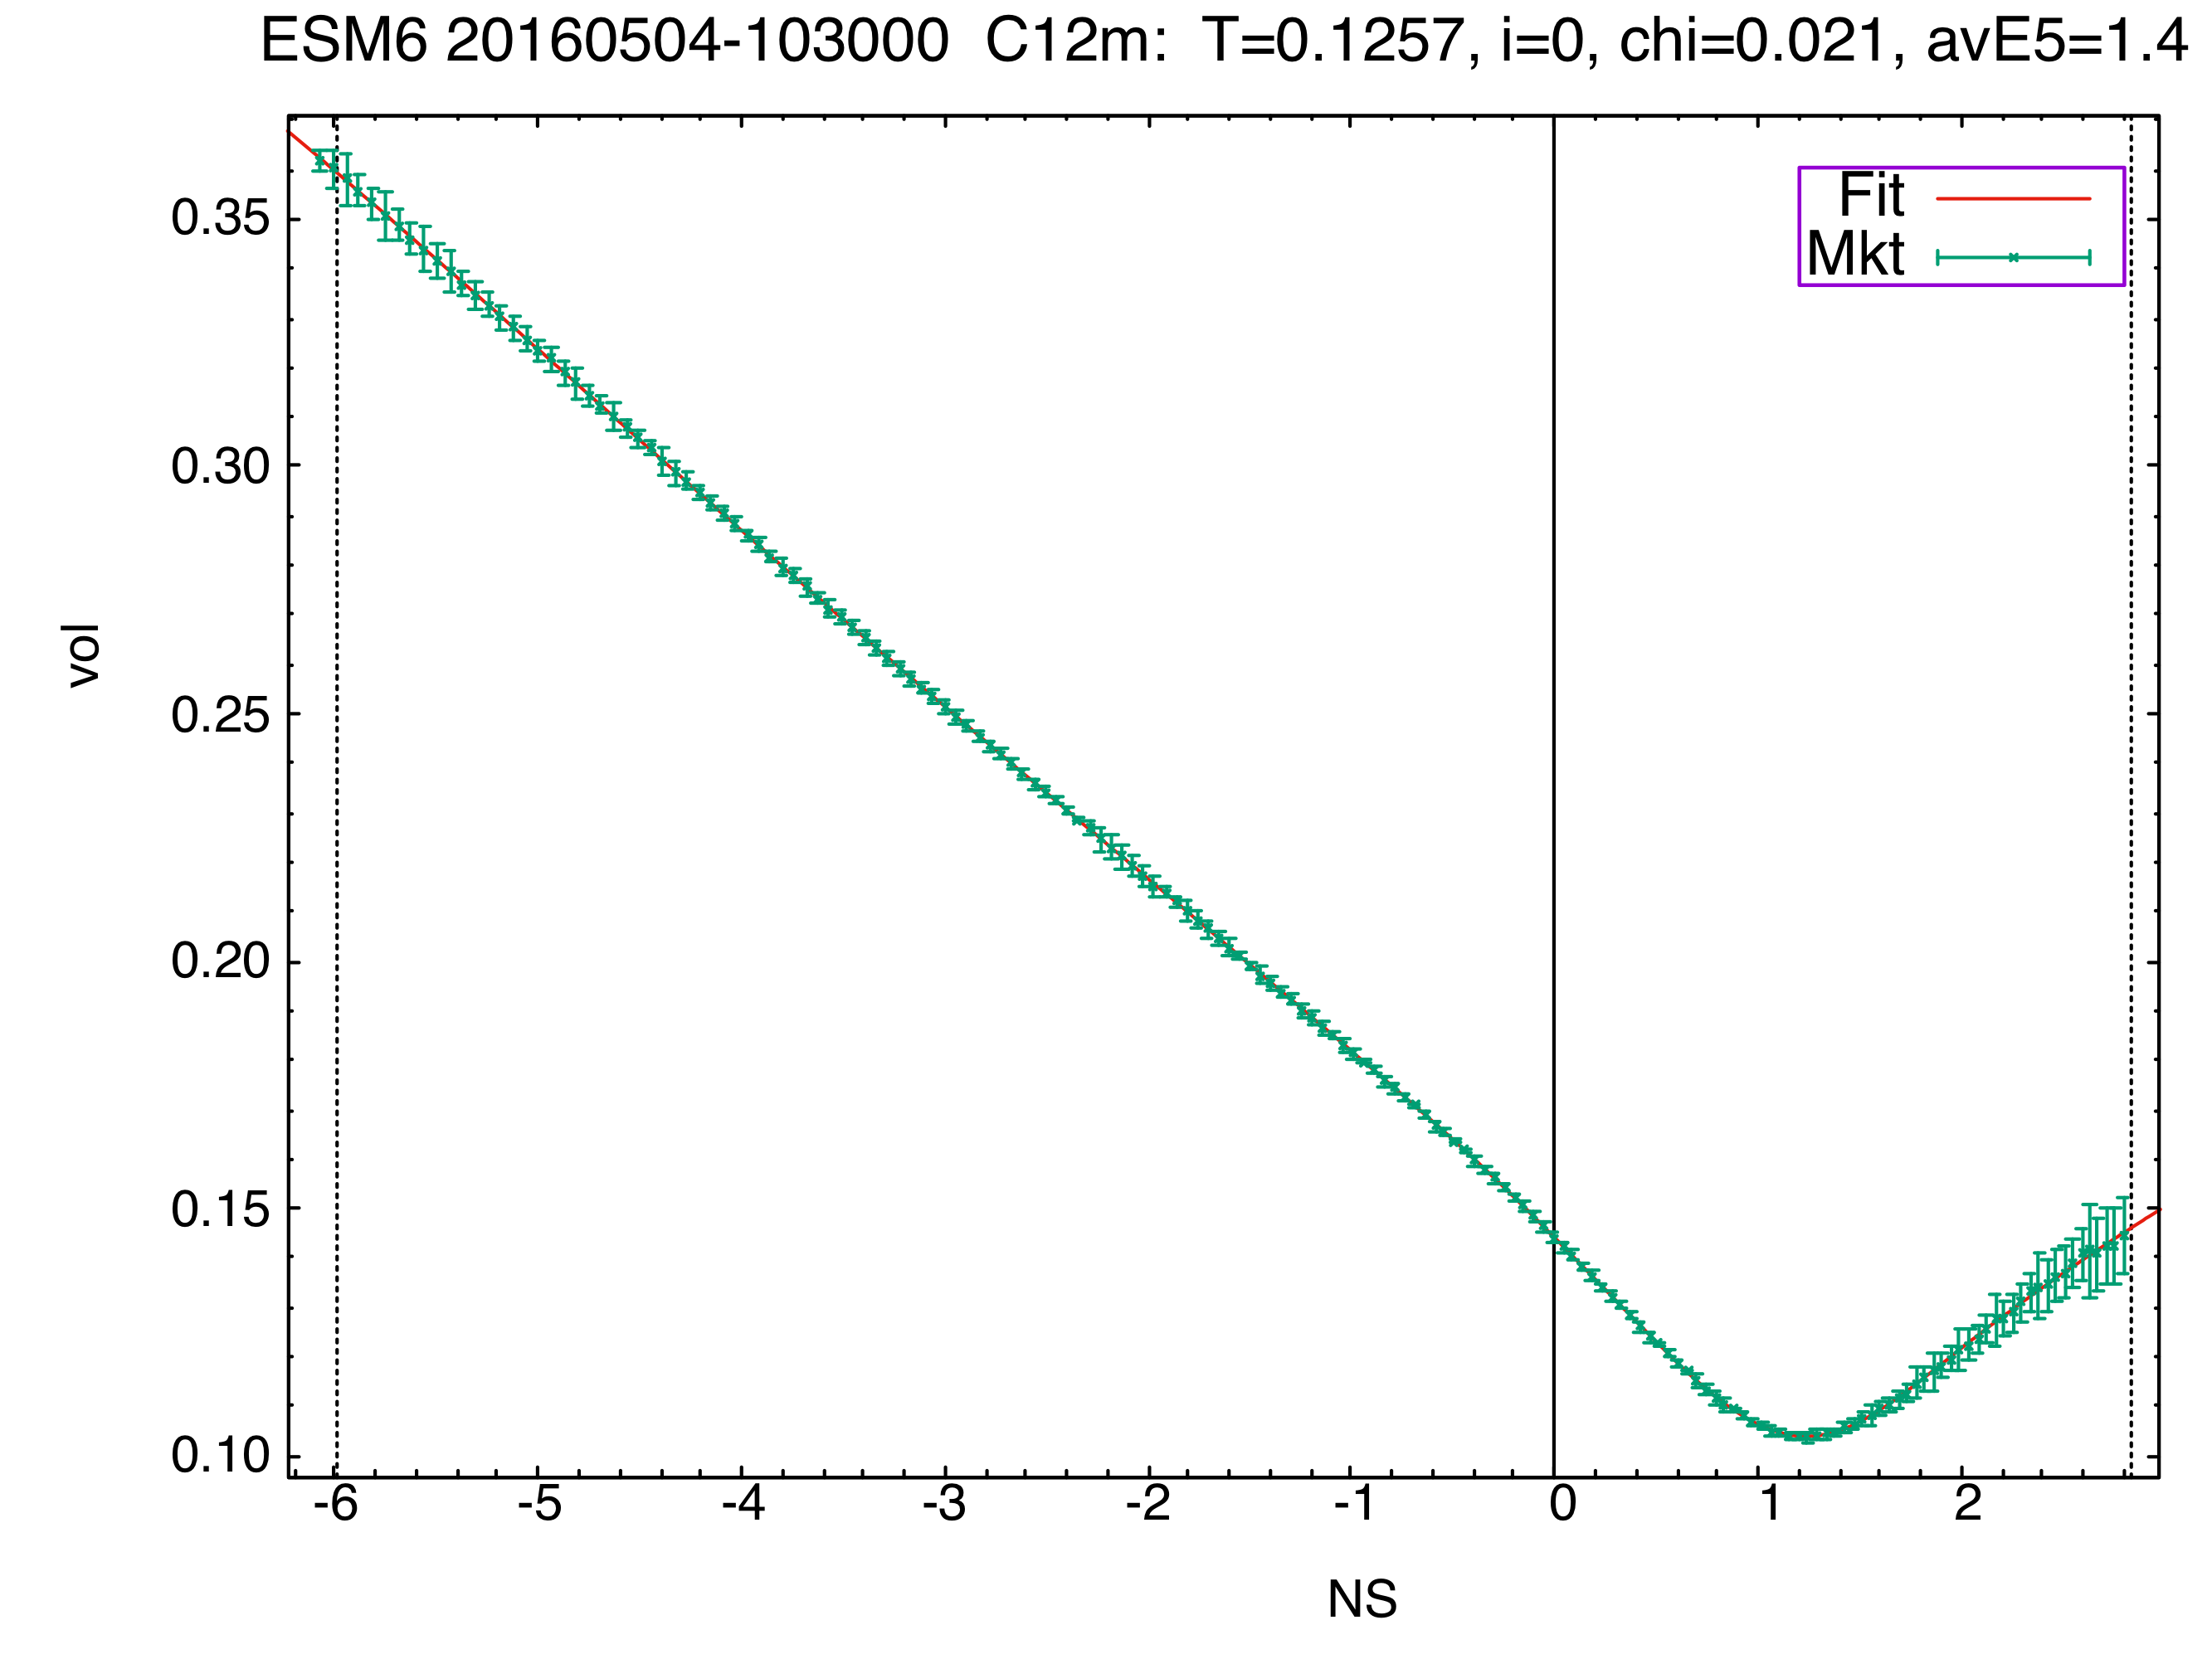
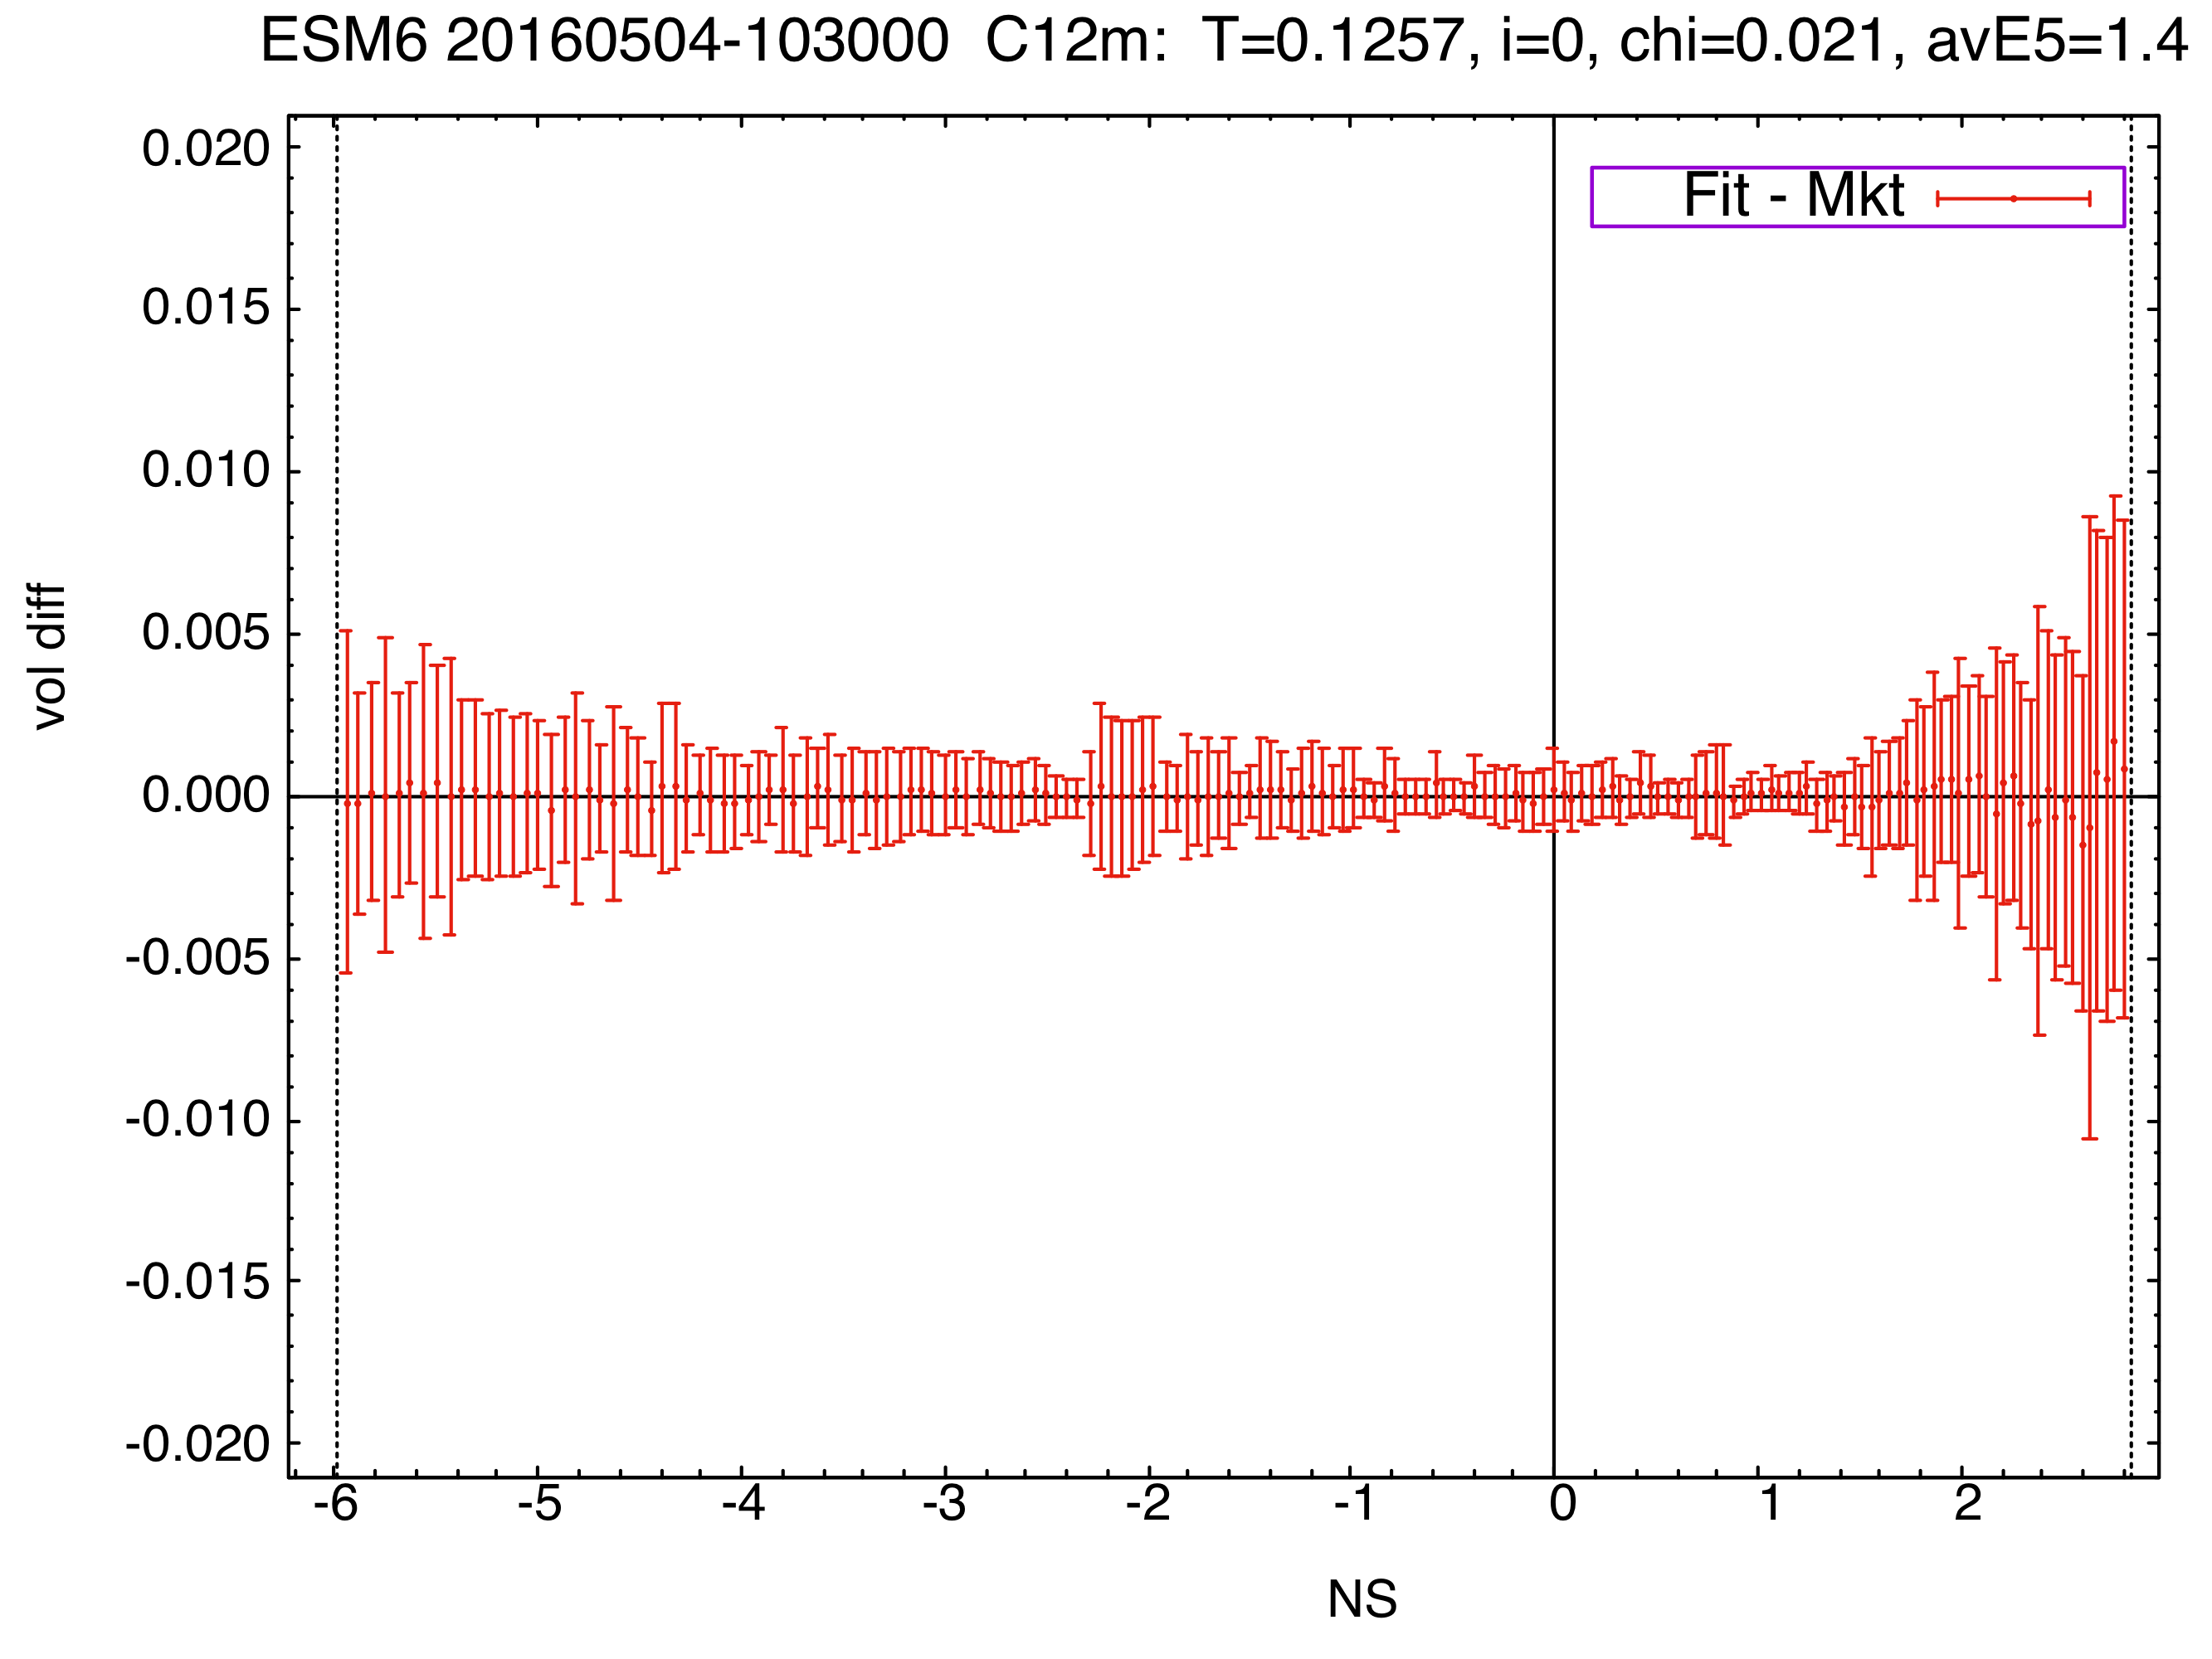
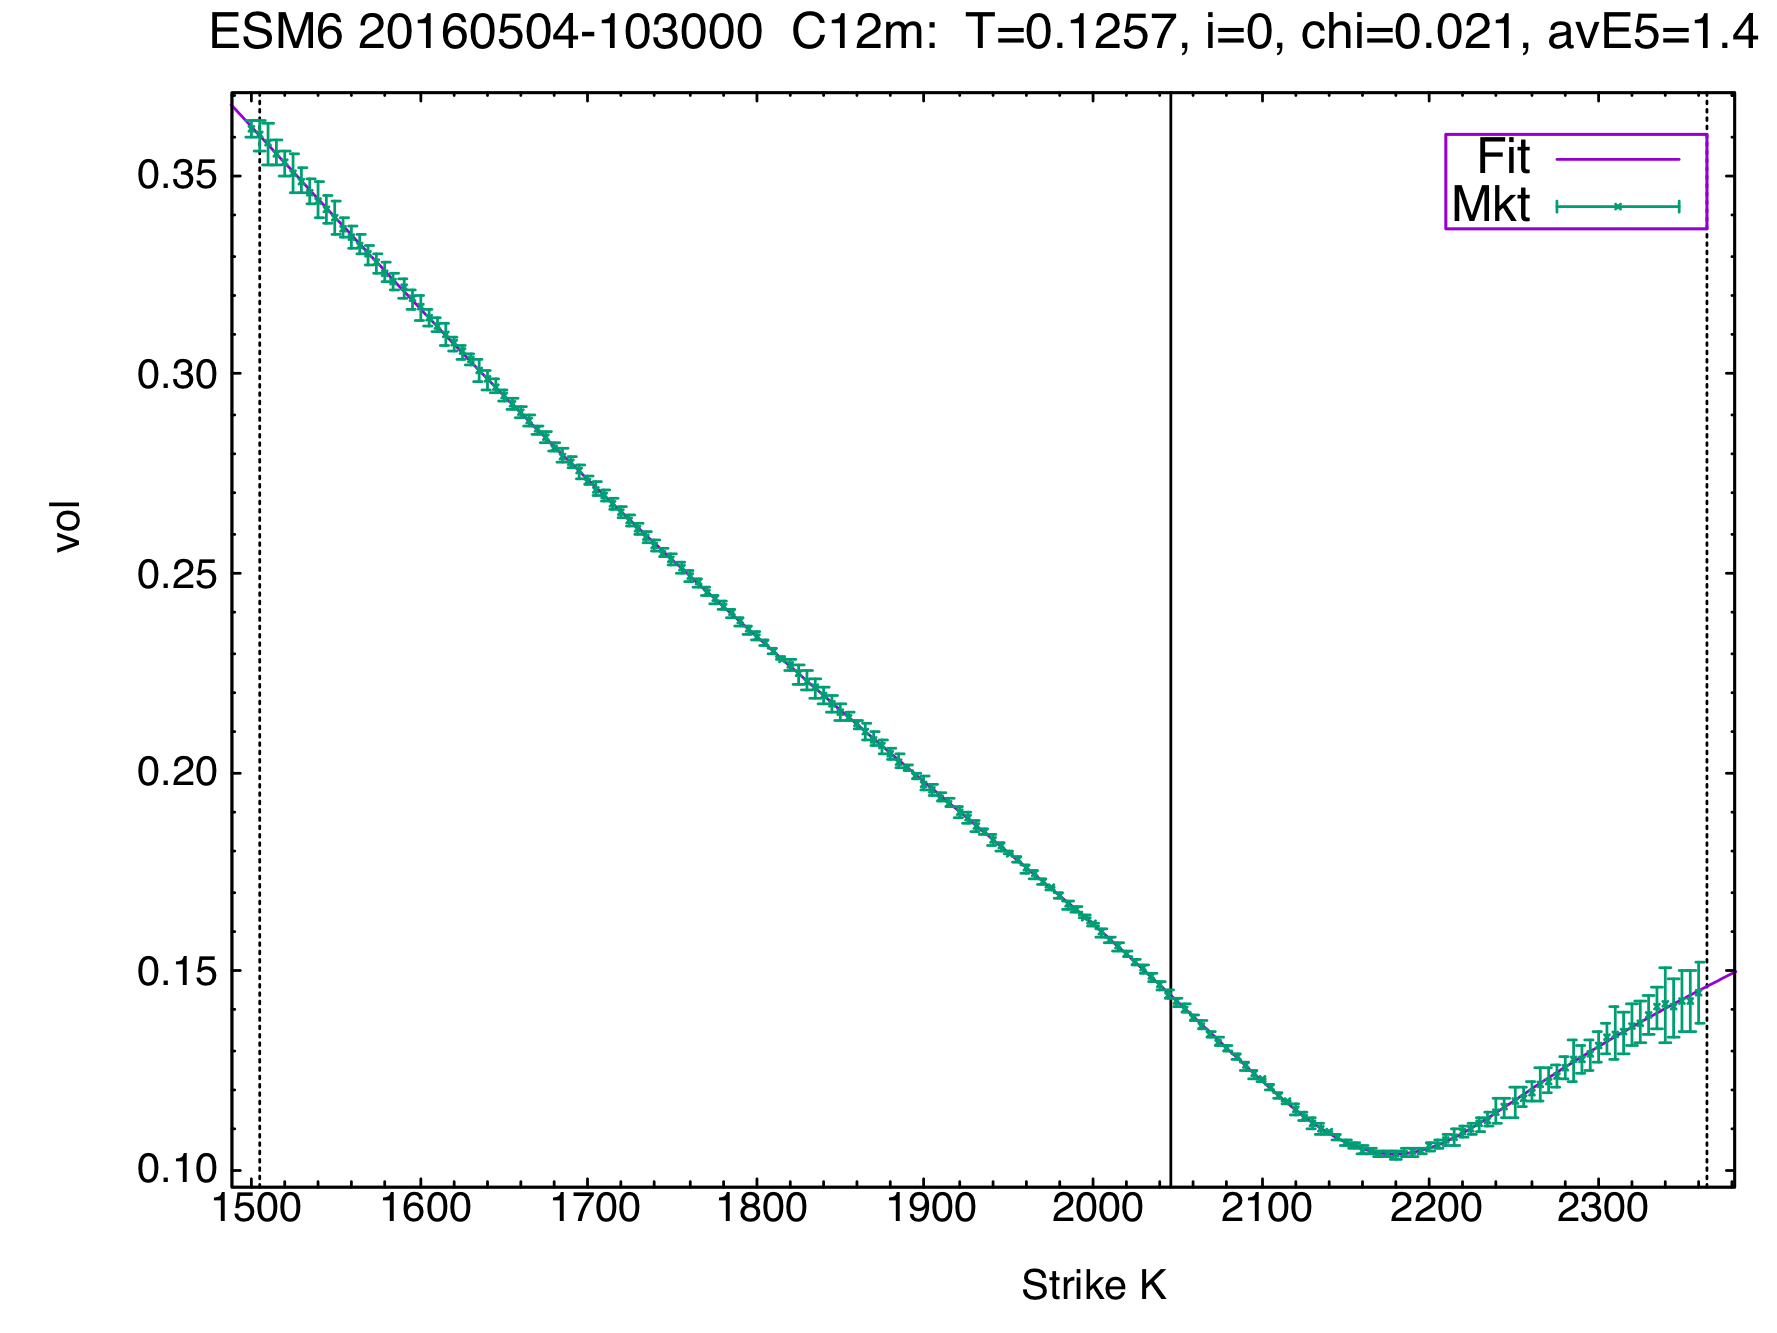
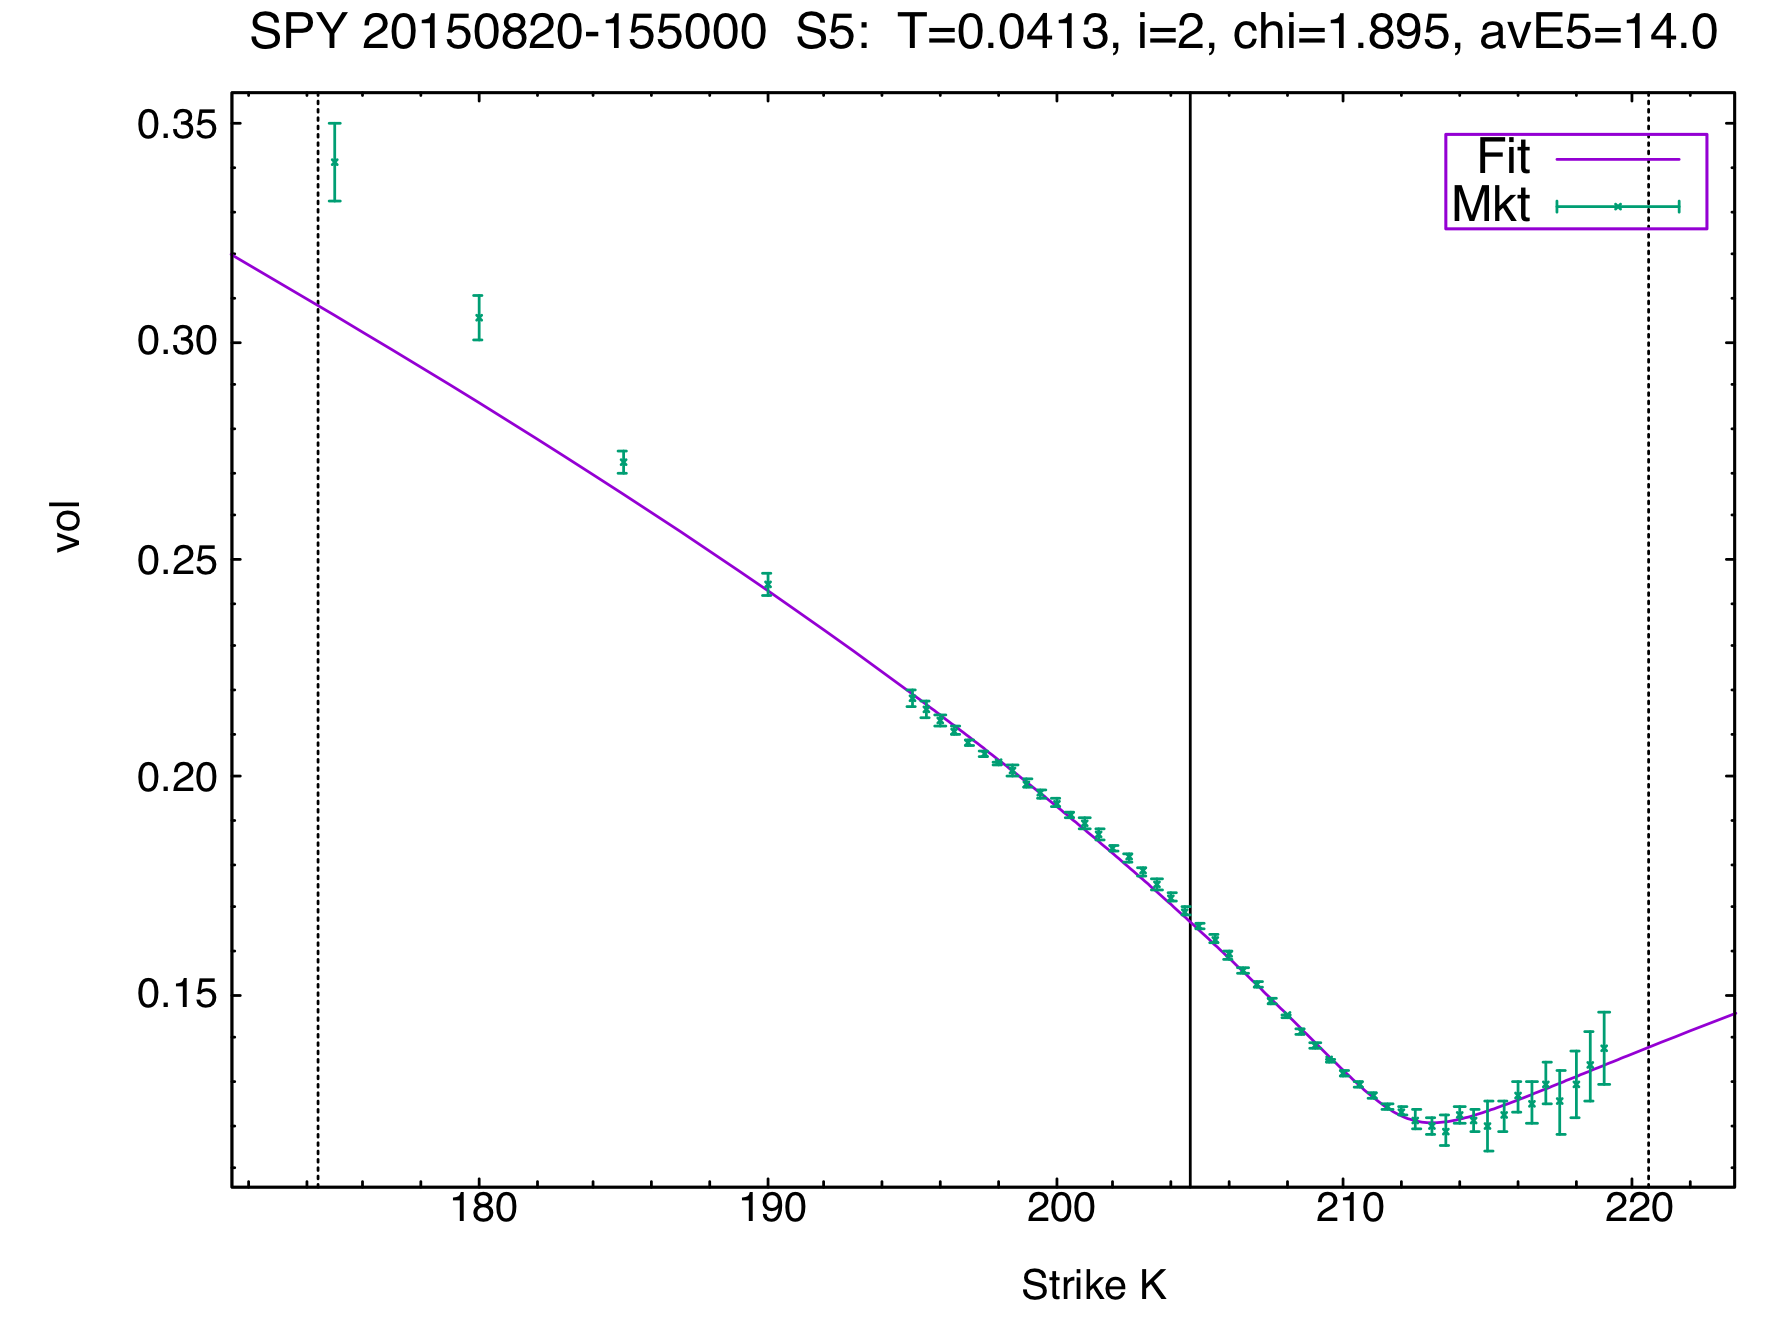
Here we advise to use the C12 curve. Its chi=0.021 is over 300x better than the SVI one. It provides a bias-free fit across all strikes. The vol difference plots looks like the above on all snapshots.
You can trade off this curve and our clients do.
Some more details and comparisons
S5
C12m
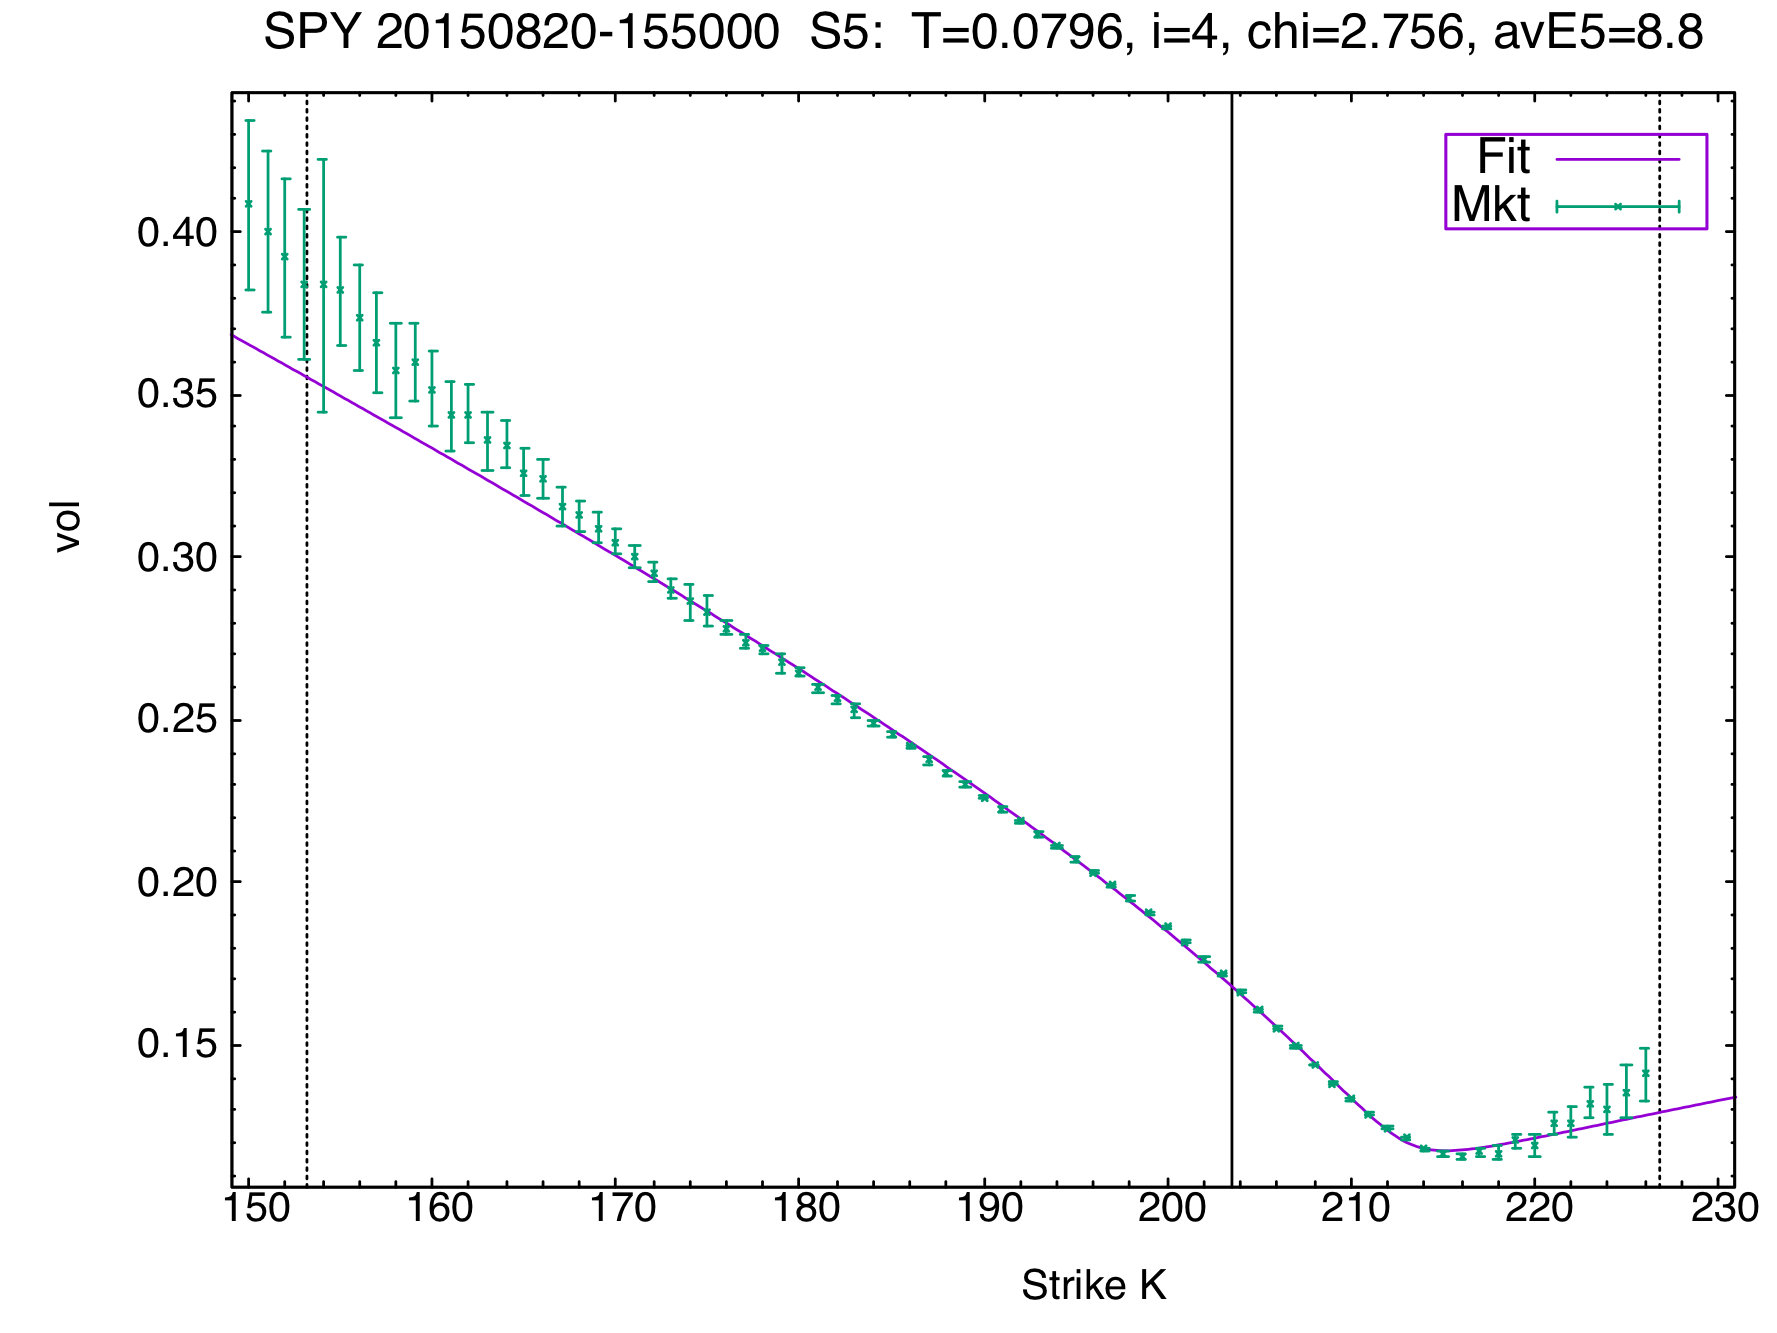
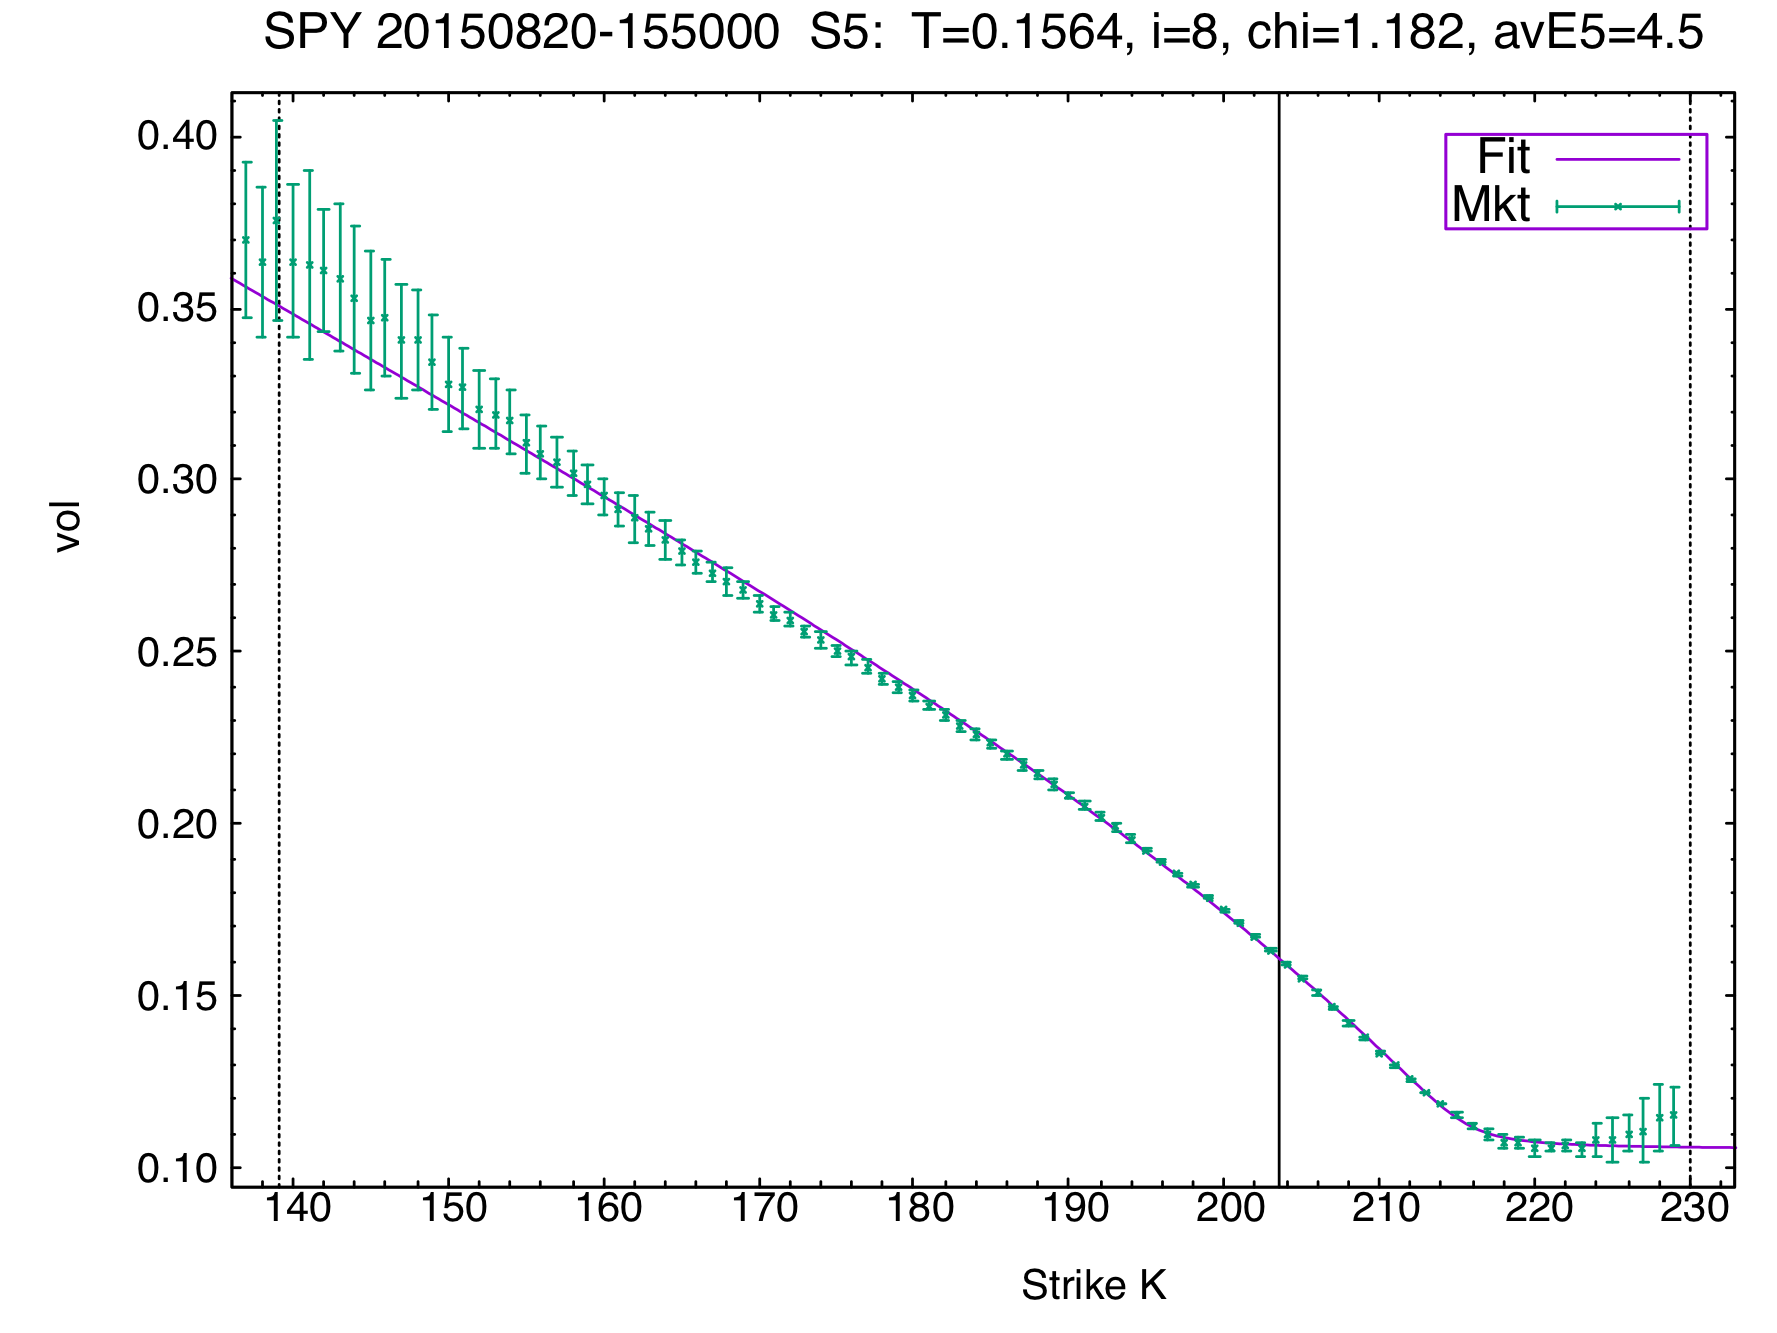
S5
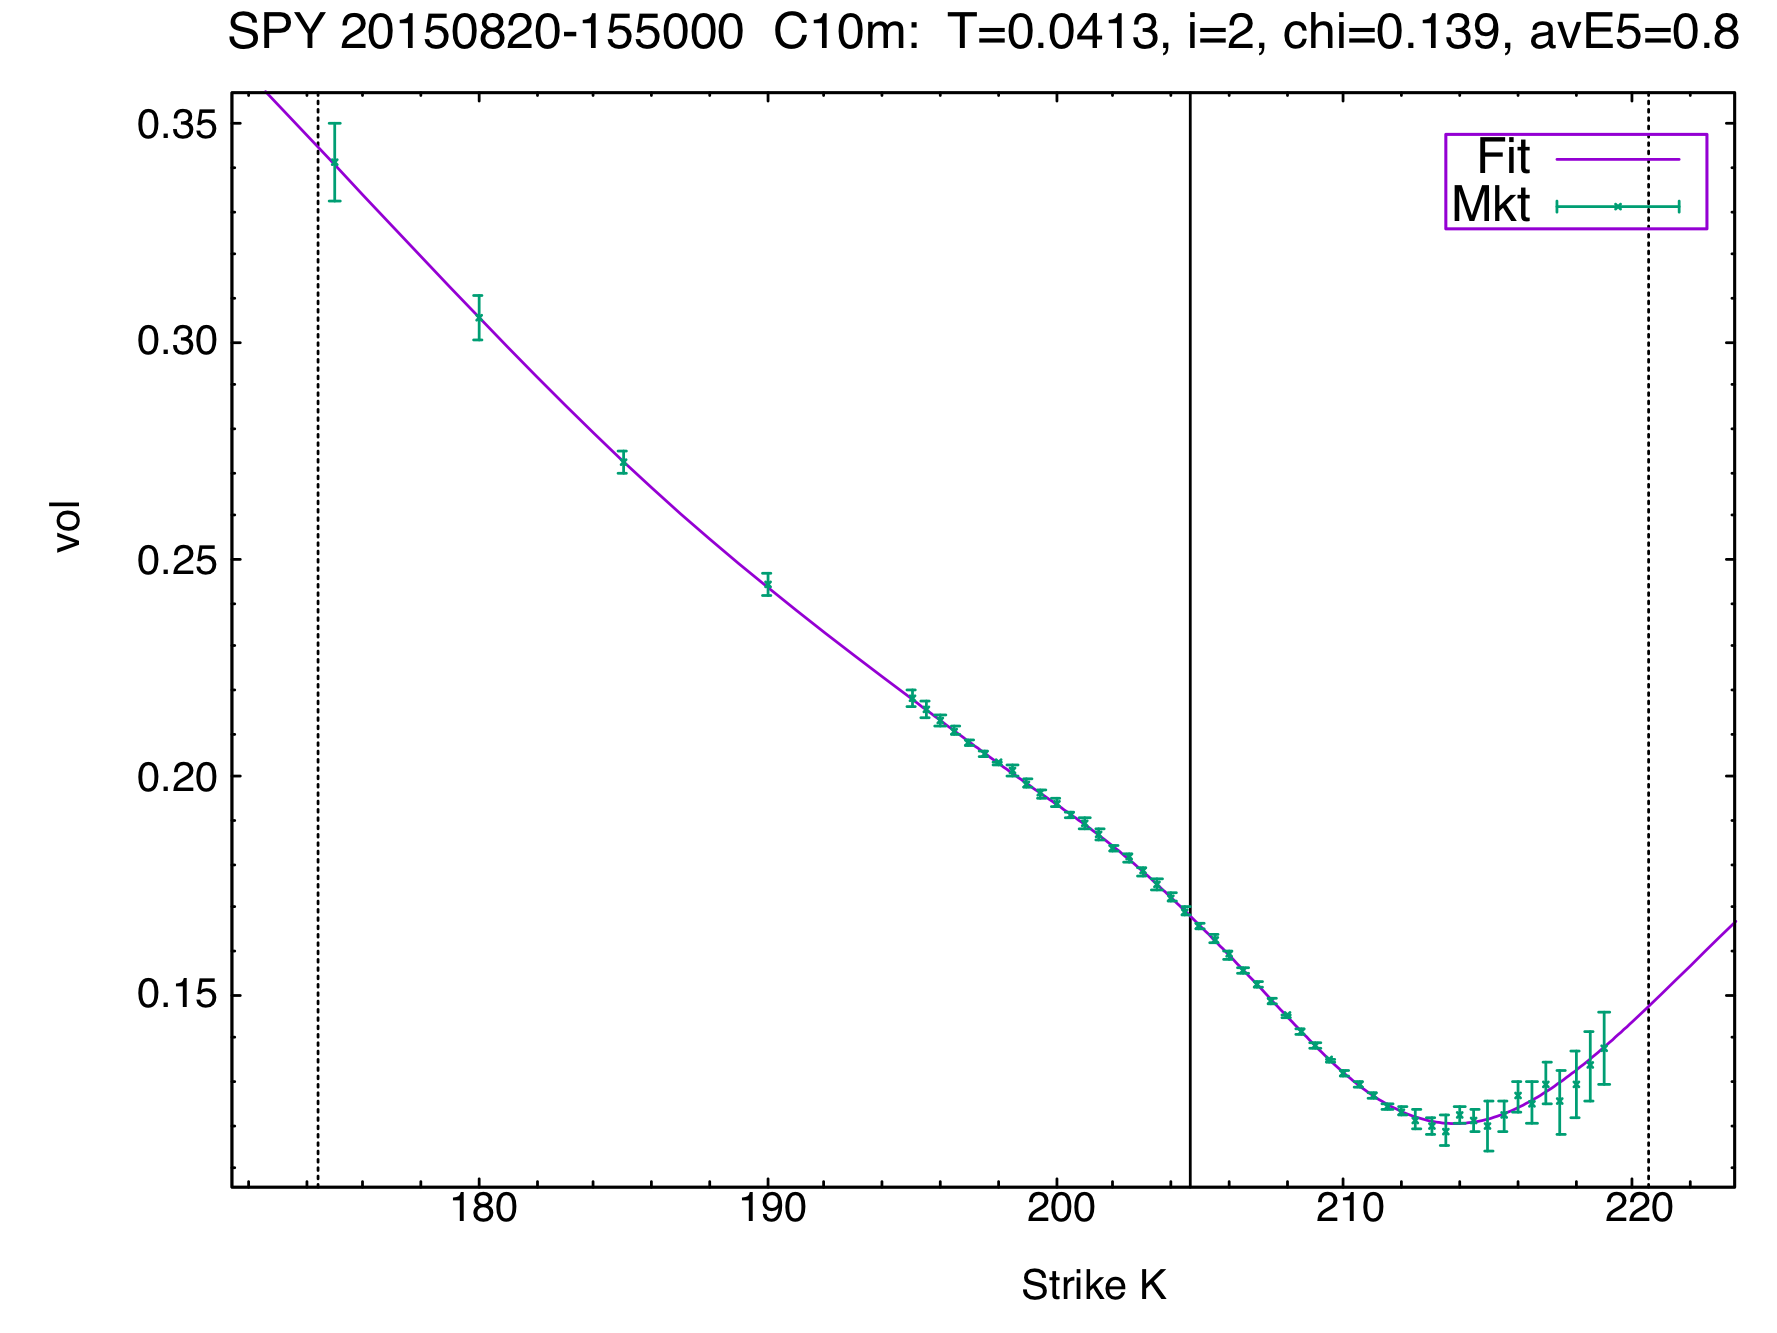
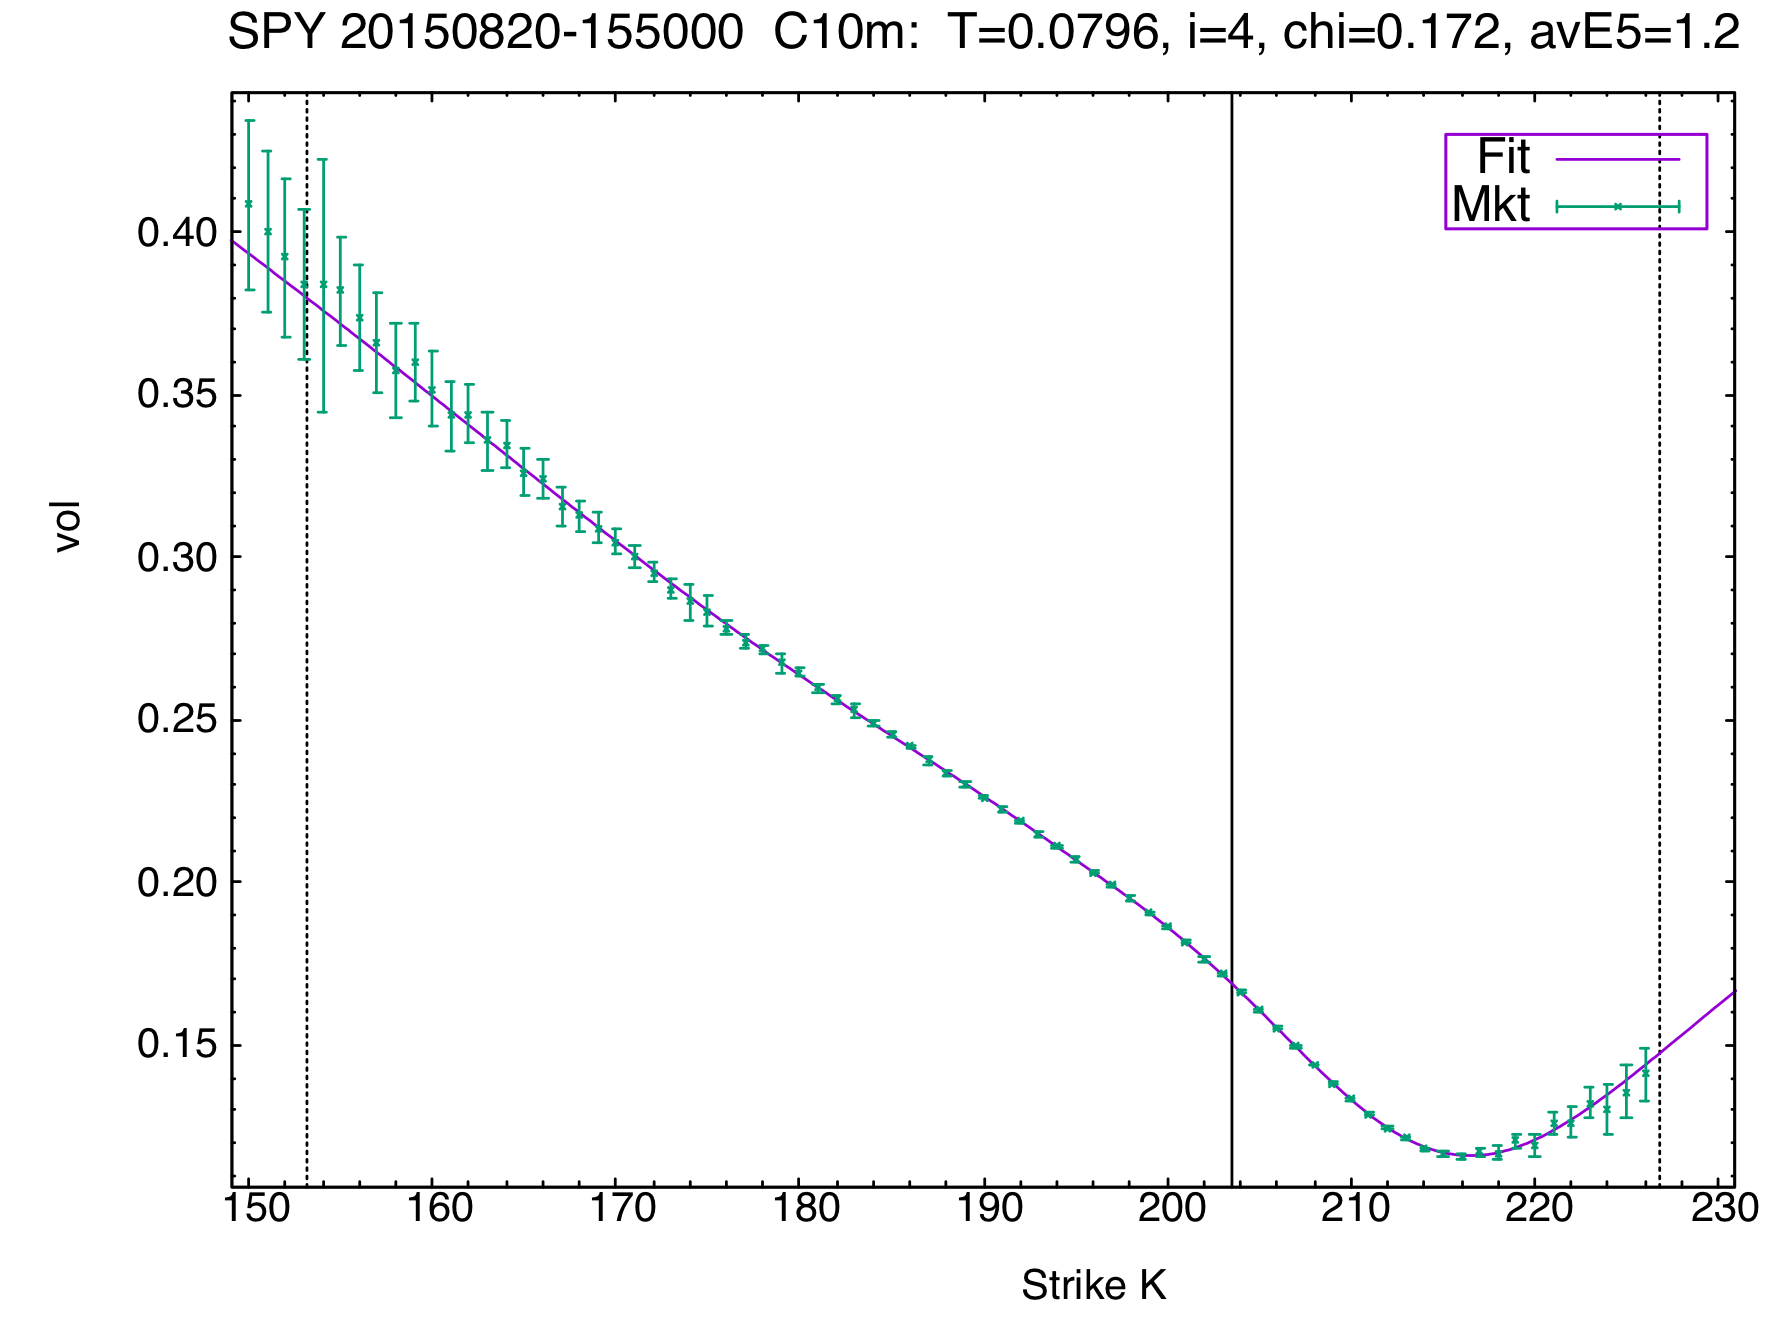
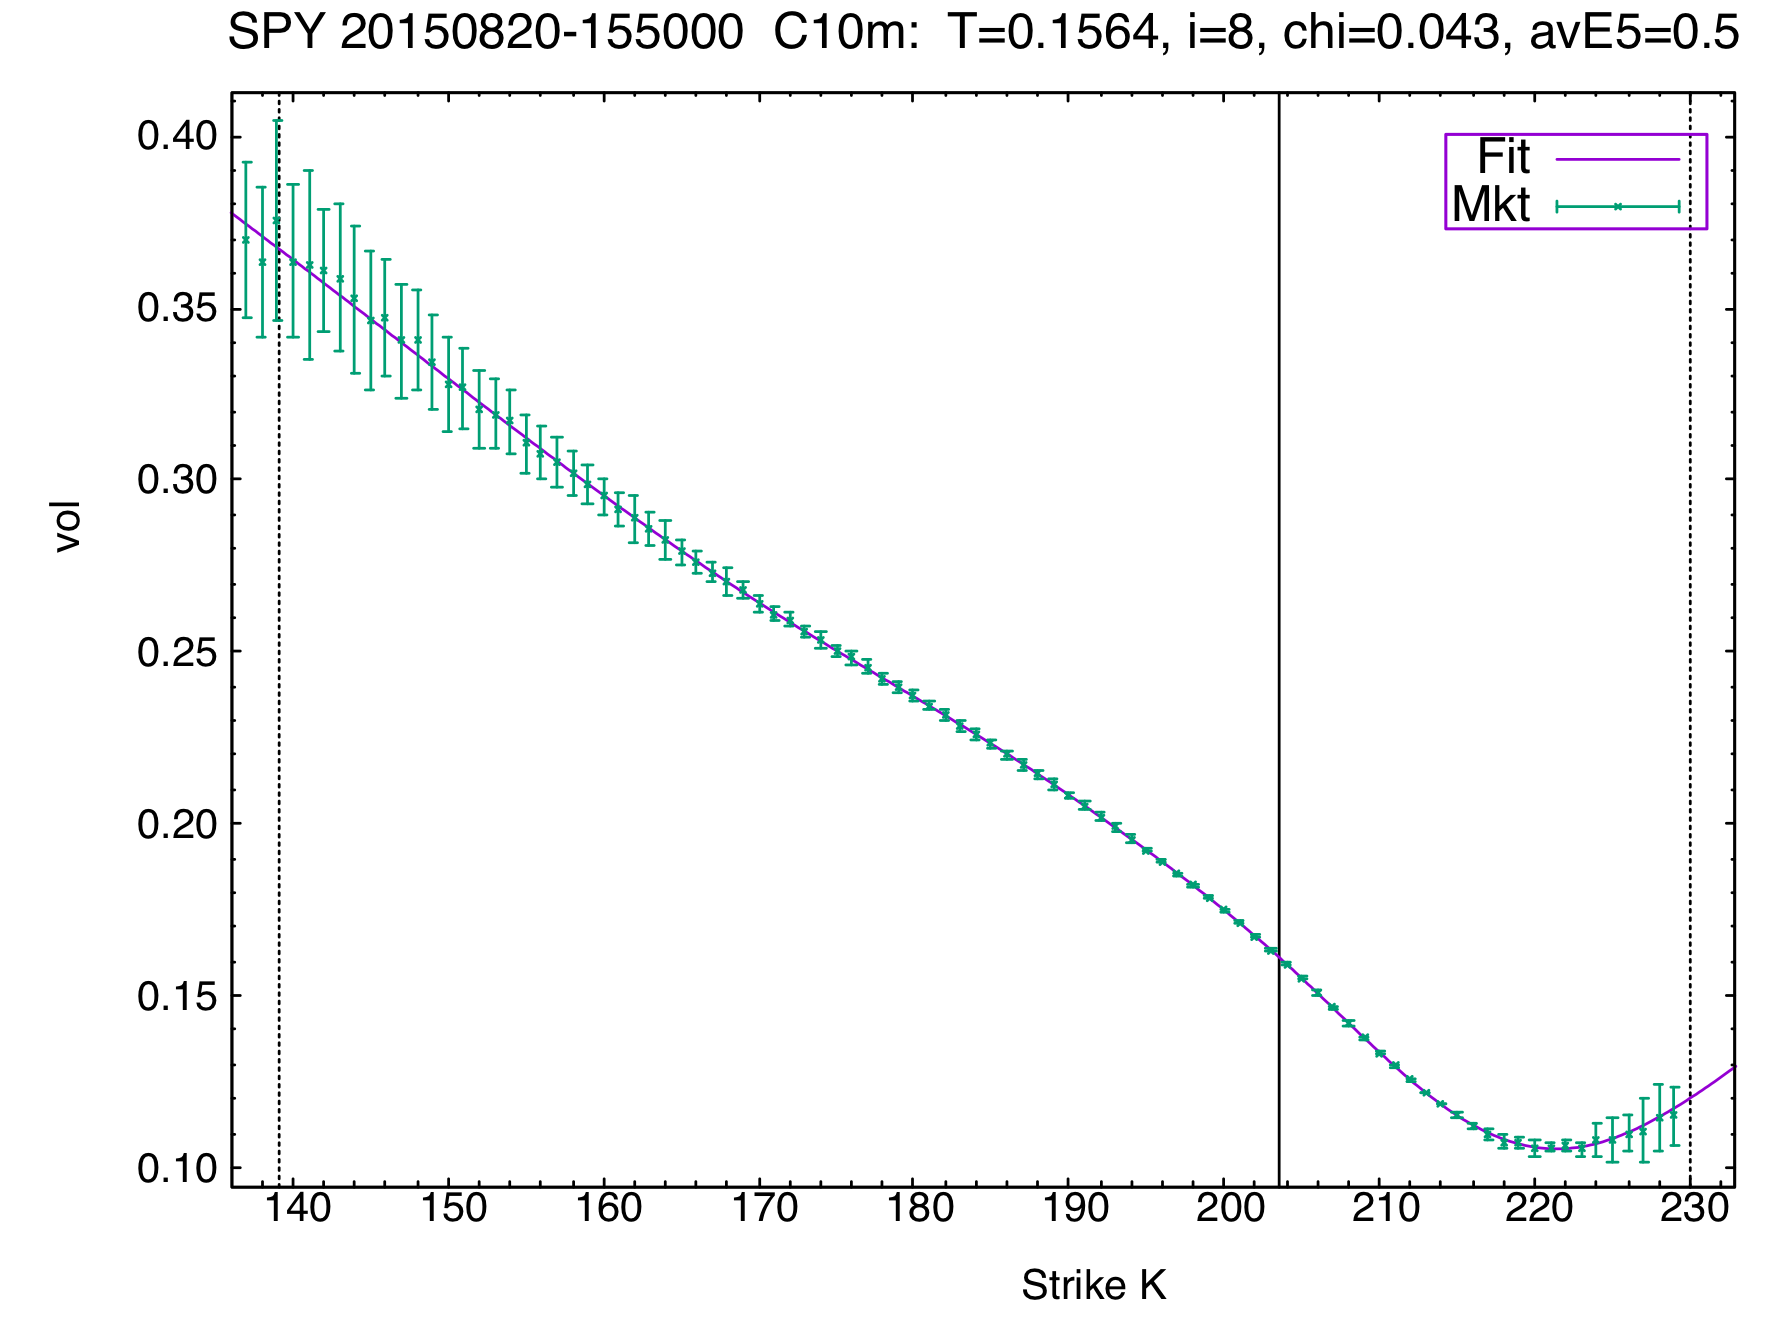
C10m
S5
C10m
S5
C10m
S5
C10m
S5
C10m
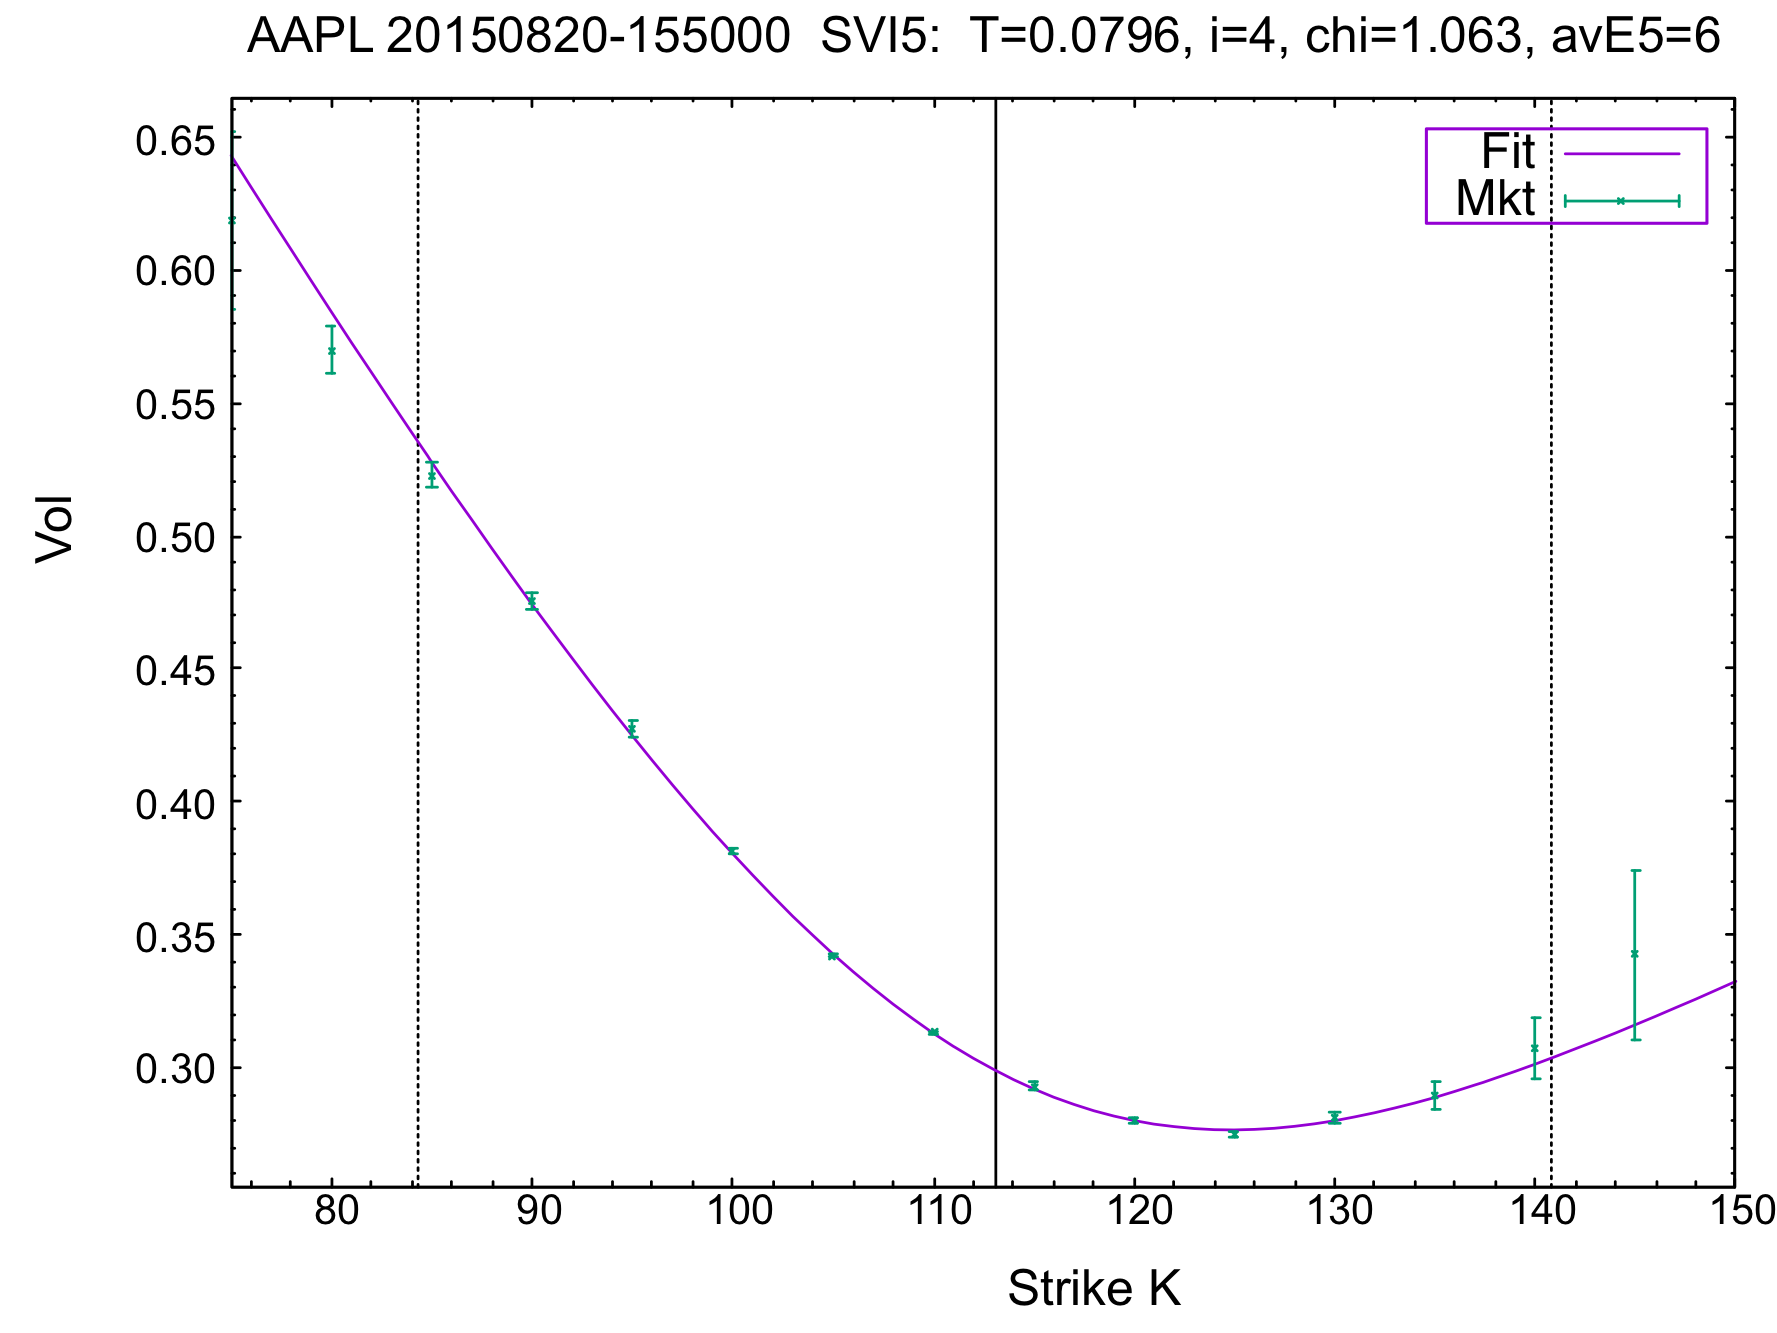
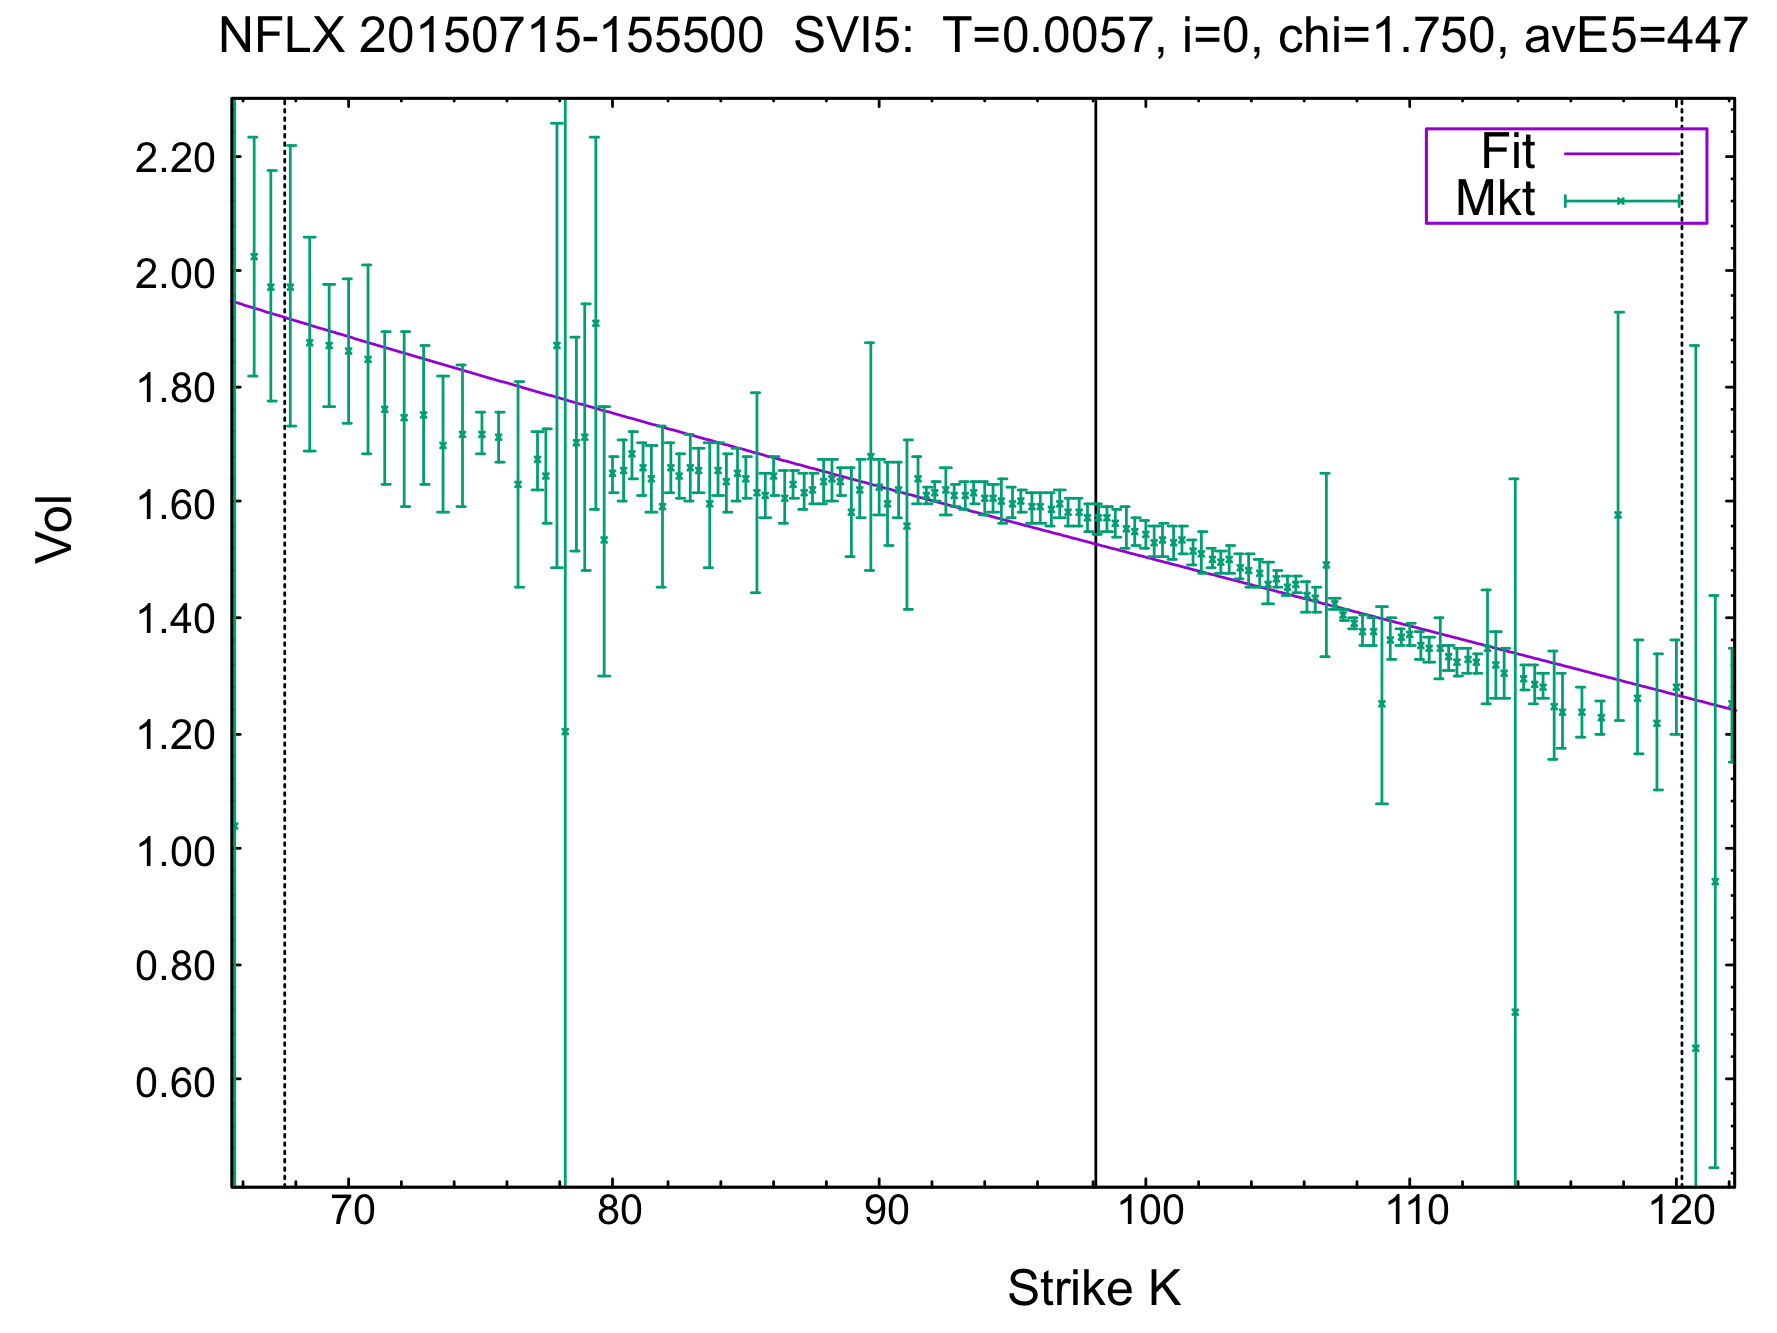
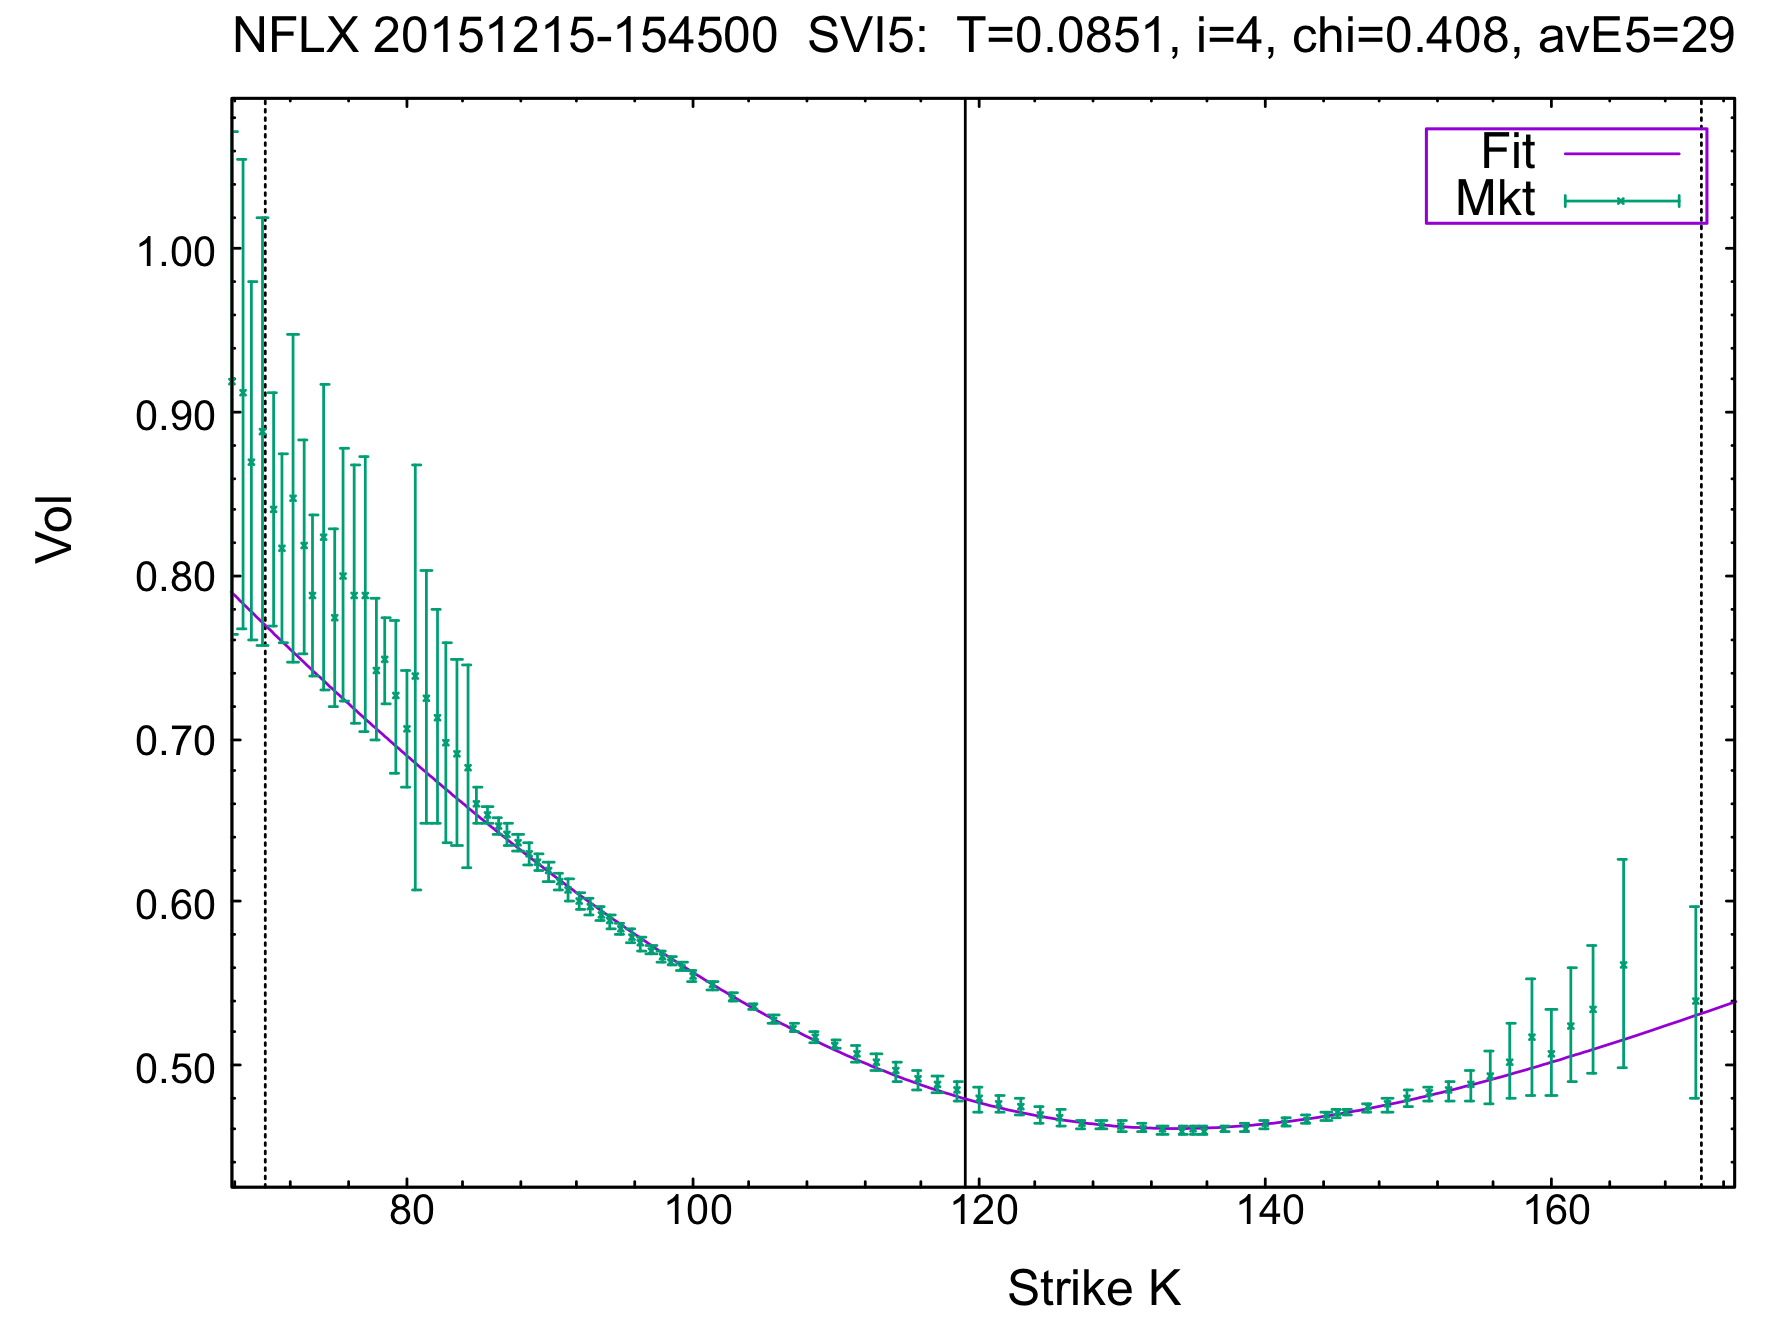
SVI5
C8
SVI5
C8
SVI5
C8
SVI5
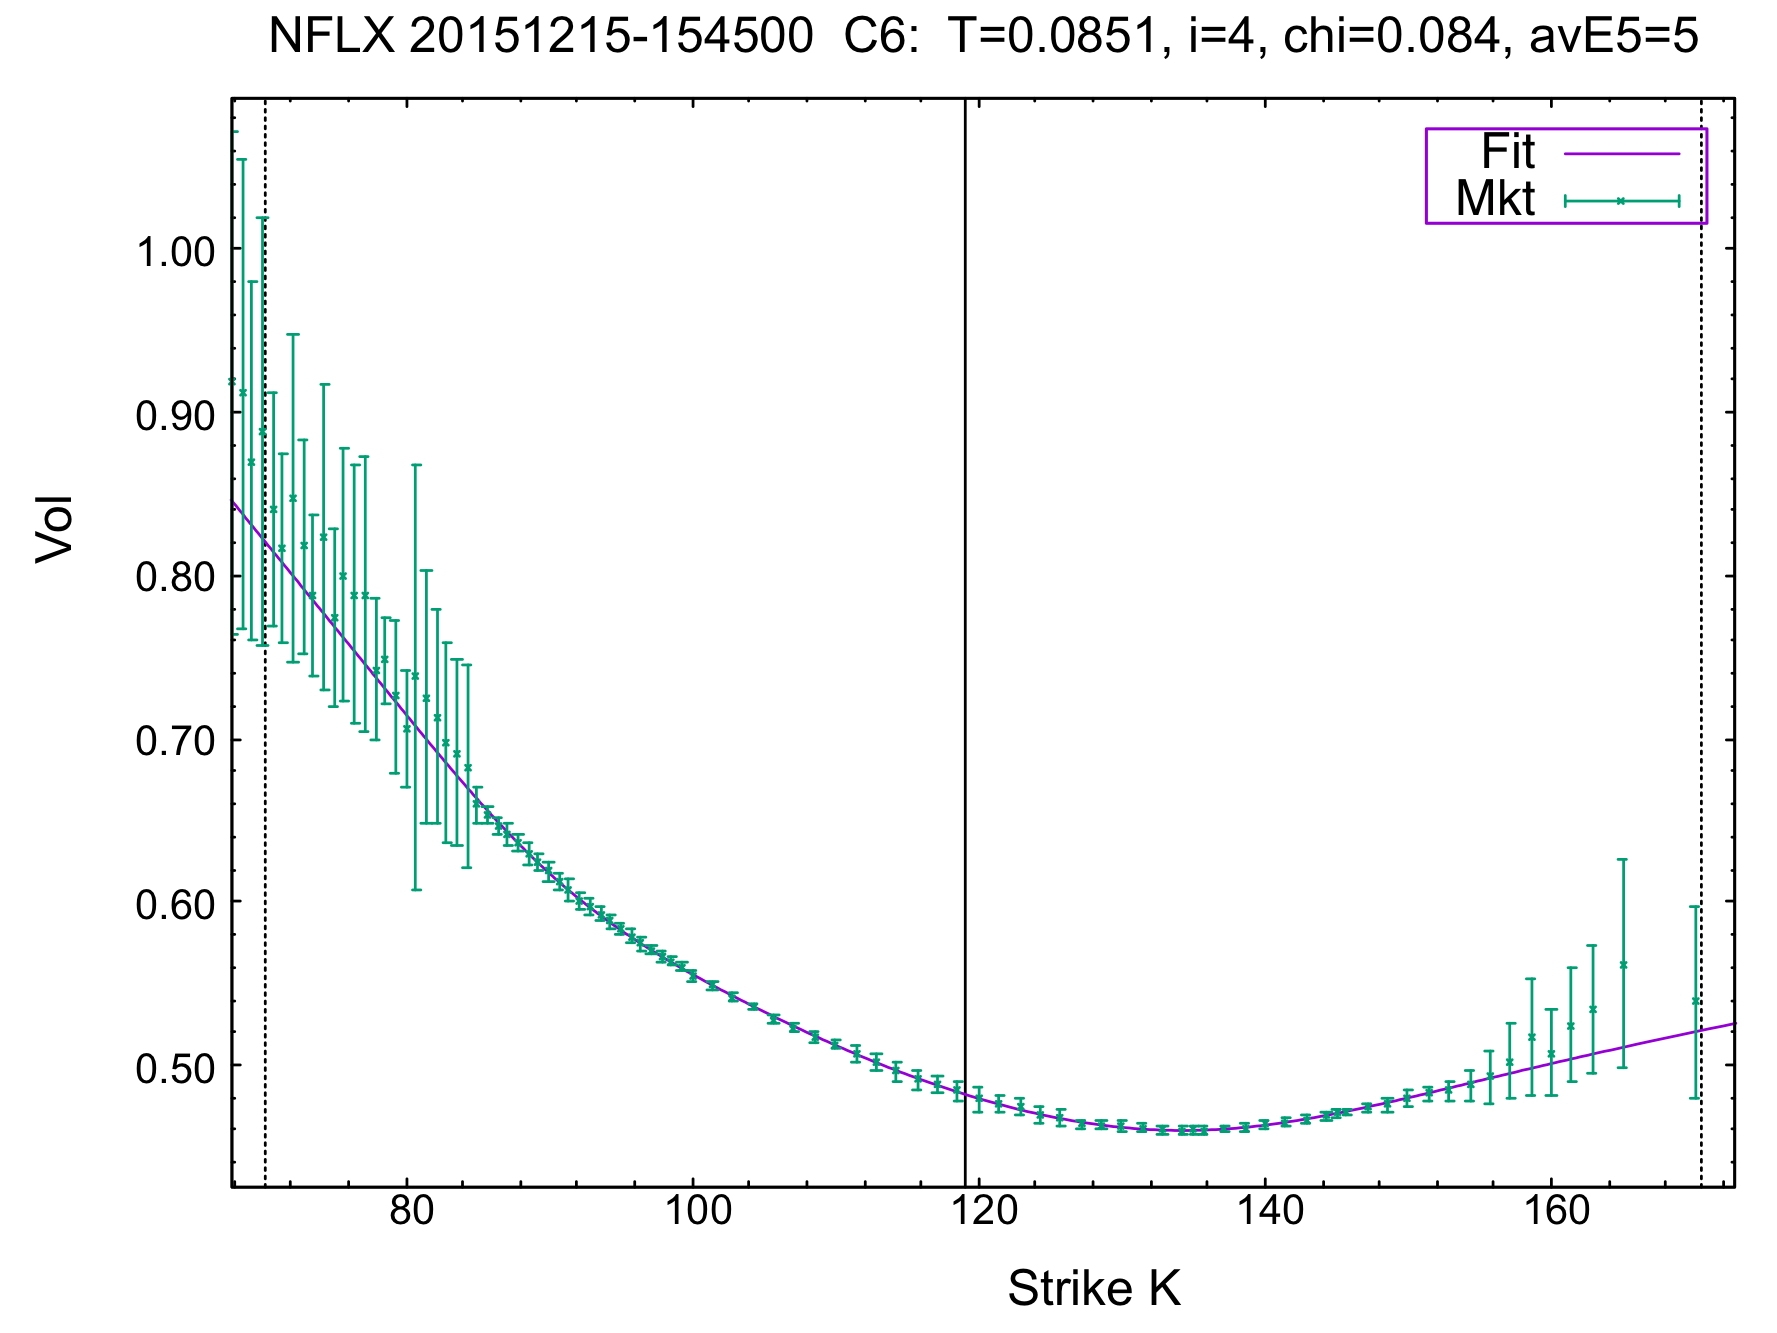
C6
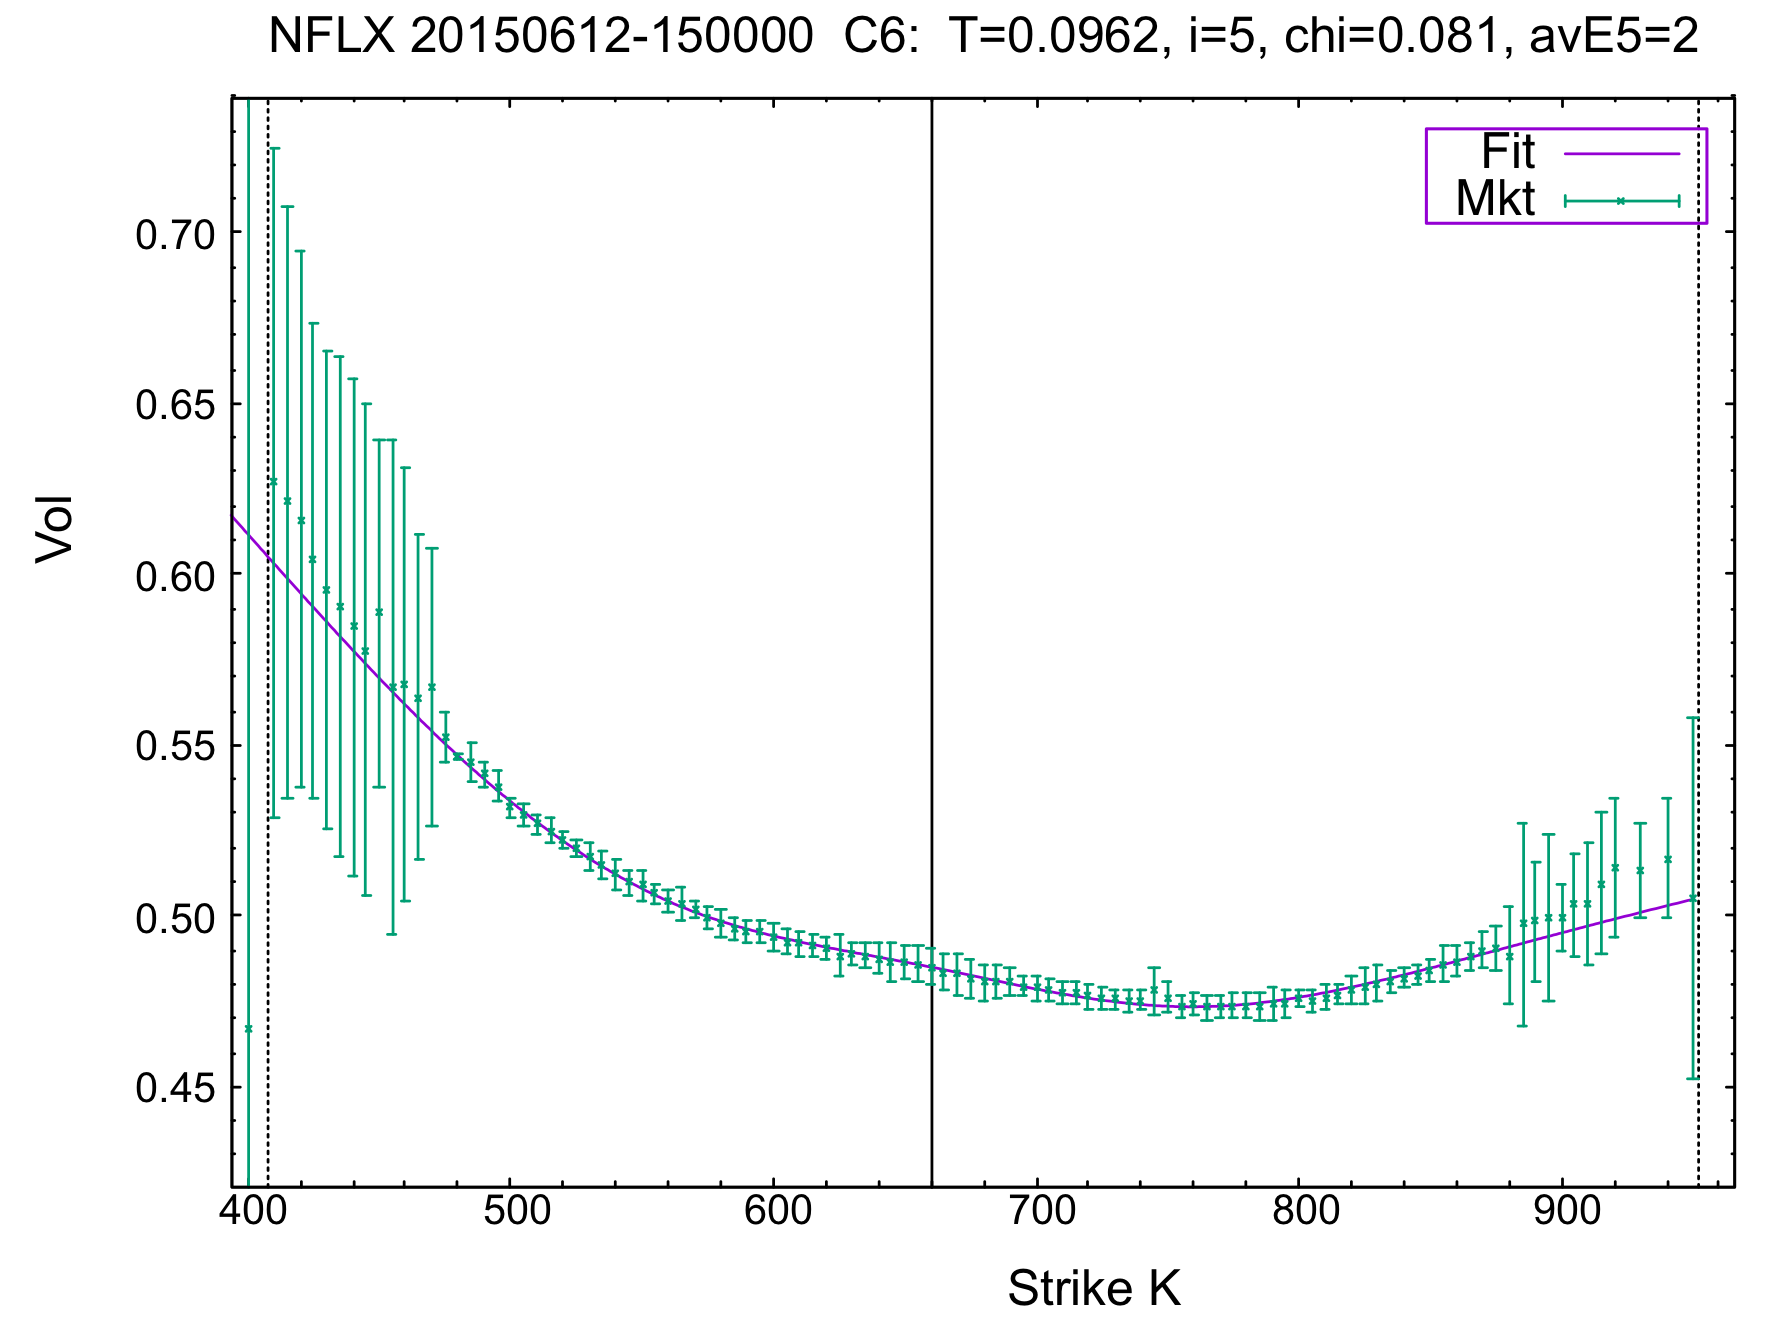
SVI5
C6
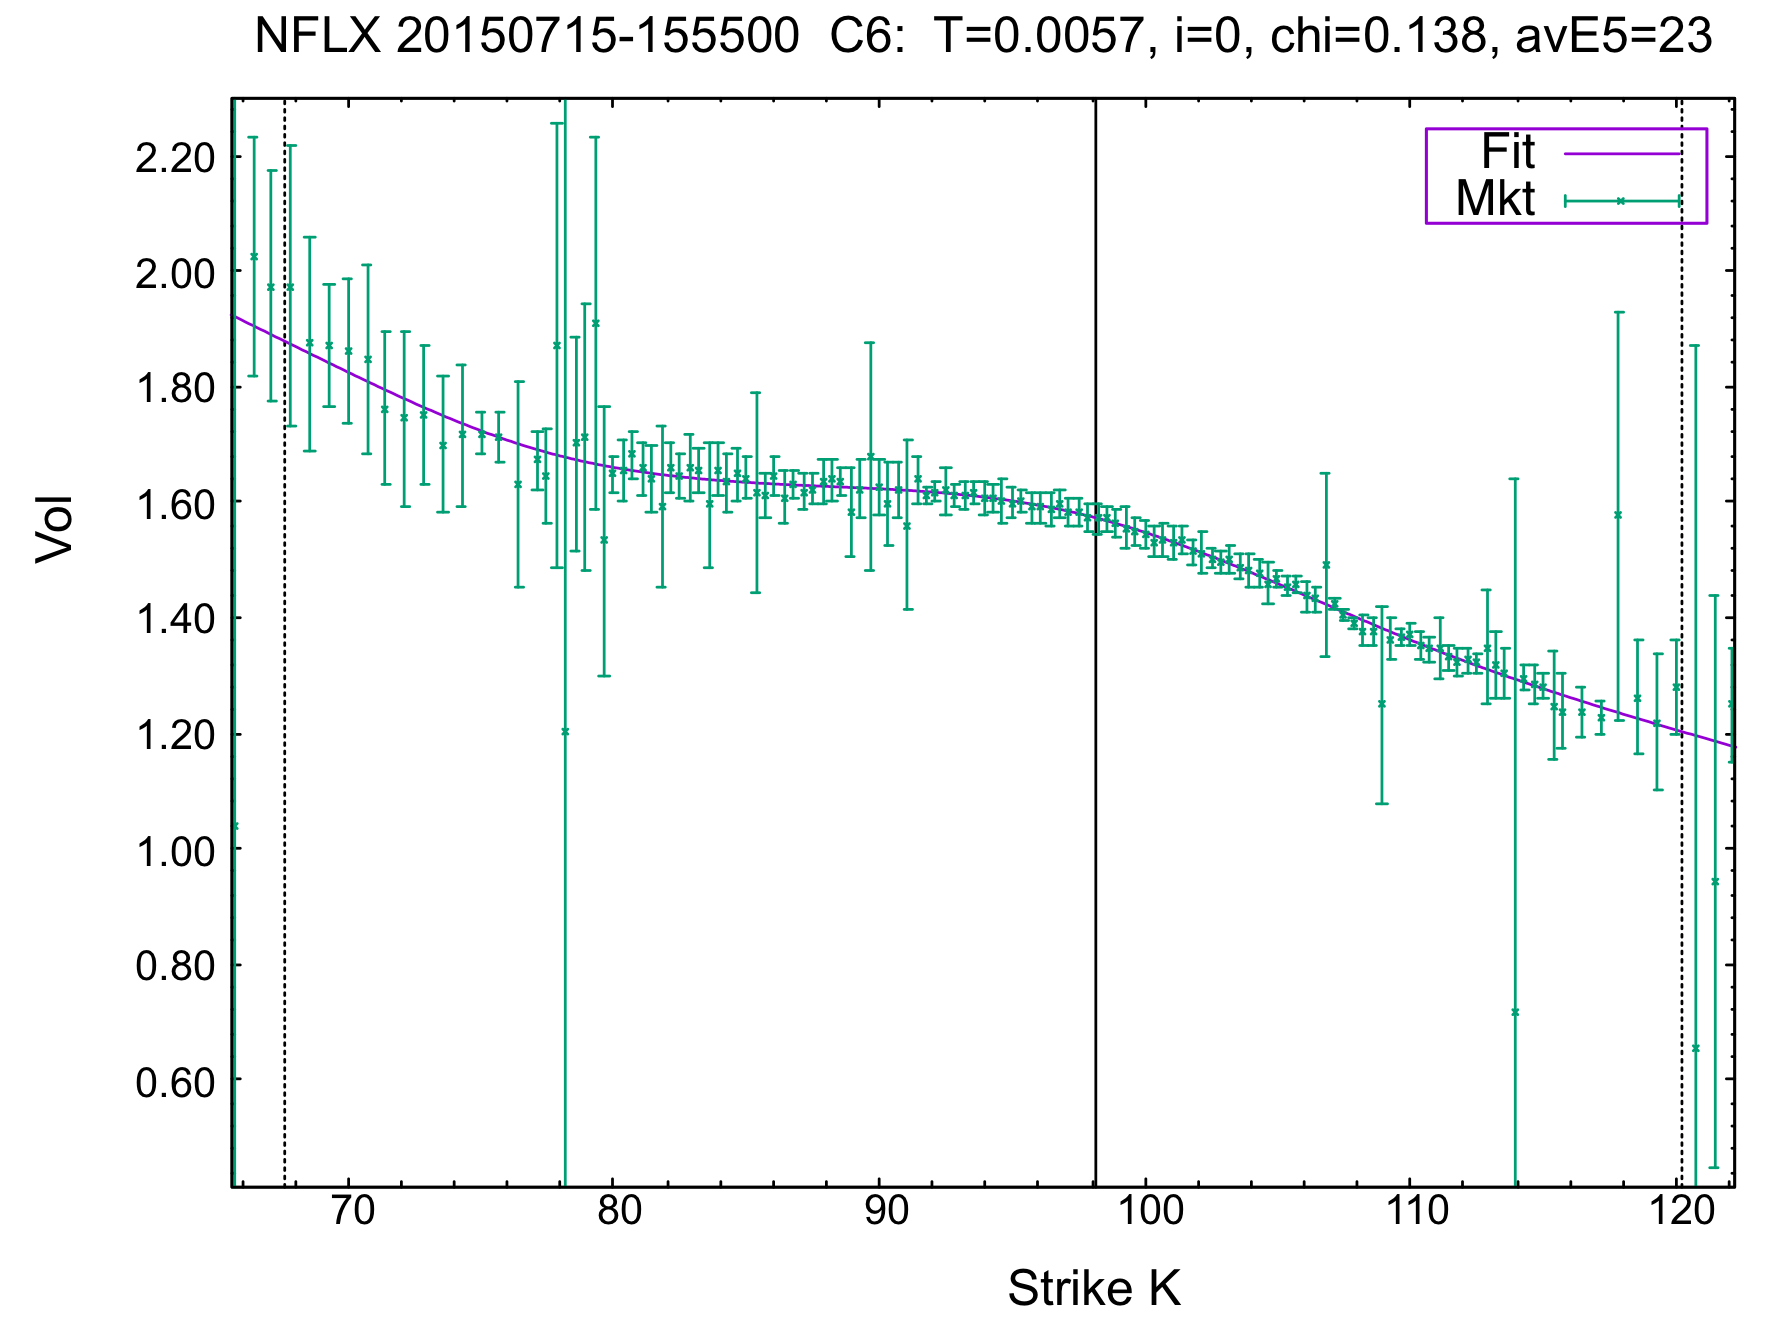
SVI5
C6
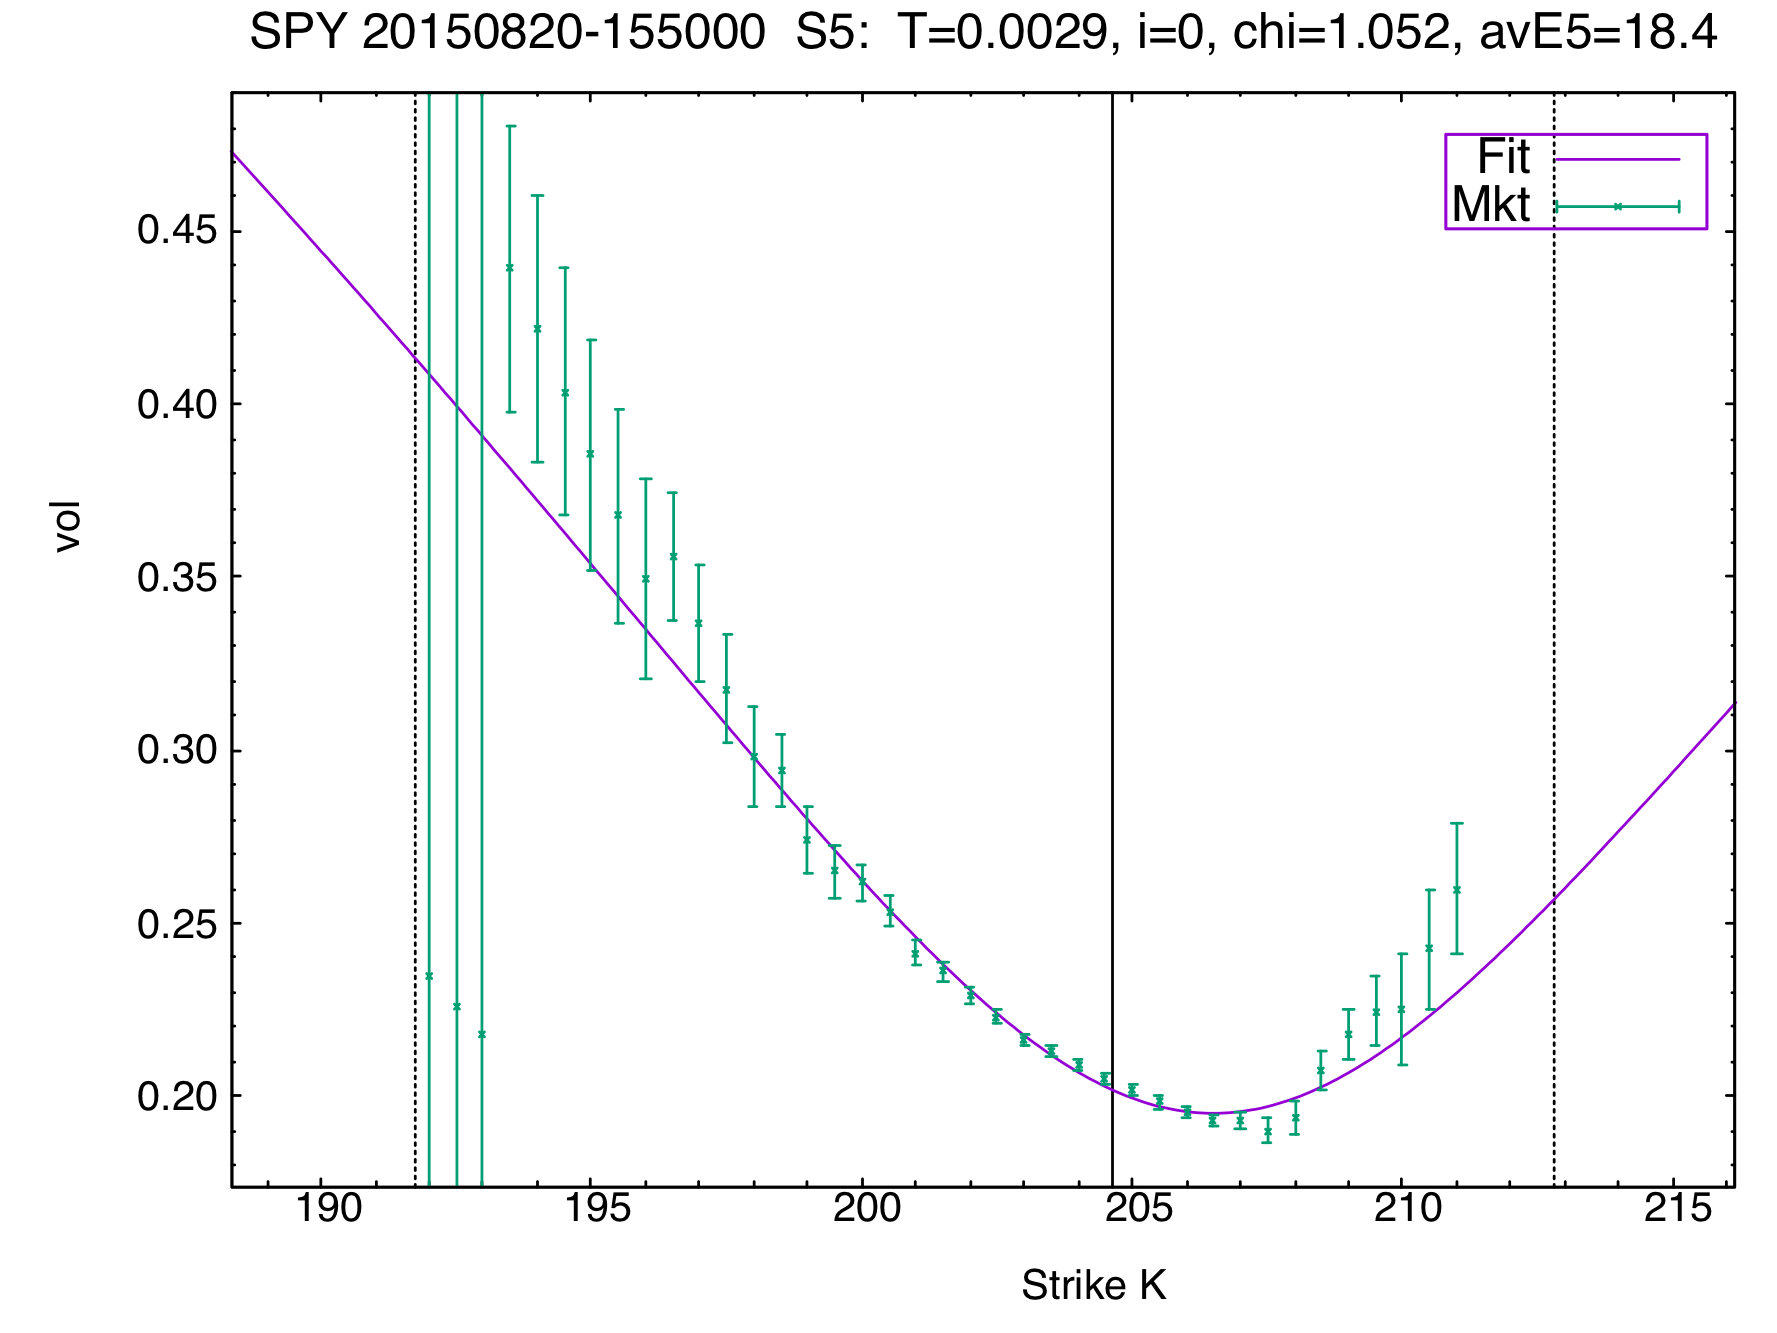
The best vol curve parametrization in the public domain is Jim Gatheral’s 5-parameter SVI curve. But, somewhat surprisingly perhaps, it does not allow one to fit some of the most liquid options in the world, like some in the SPX-VIX complex, or on tech names like AAPL, AMZN. Even qualitatively this is clear around events like FOMC for SPX, SPY, or earnings for technology names, since then the vol curve can have negative curvature around at-the-money, which is not allowed by the SVI curve1. But even away from such events, is it clear that something like our C* family of curves is needed to fit the options market on underliers like the above (and there are many other liquid names where SVI is not sufficient)2.
We should point out that this is not just a matter of the number of parameters the curve has (here 5 vs 6, 8, 10 or 12). Instead, it is related to the qualitative shapes allowed by the different curve types, which are too restrictive for SVI compared to what the market “wants”. As proof we note that even the 5-parameter version of our family of C* curves, C5, that allows more general shapes, will often fit liquid markets dramatically better than SVI.