Example
AEX around Brexit
The Most Interesting Volsurface in the World
The Most Interesting Volsurface in the World
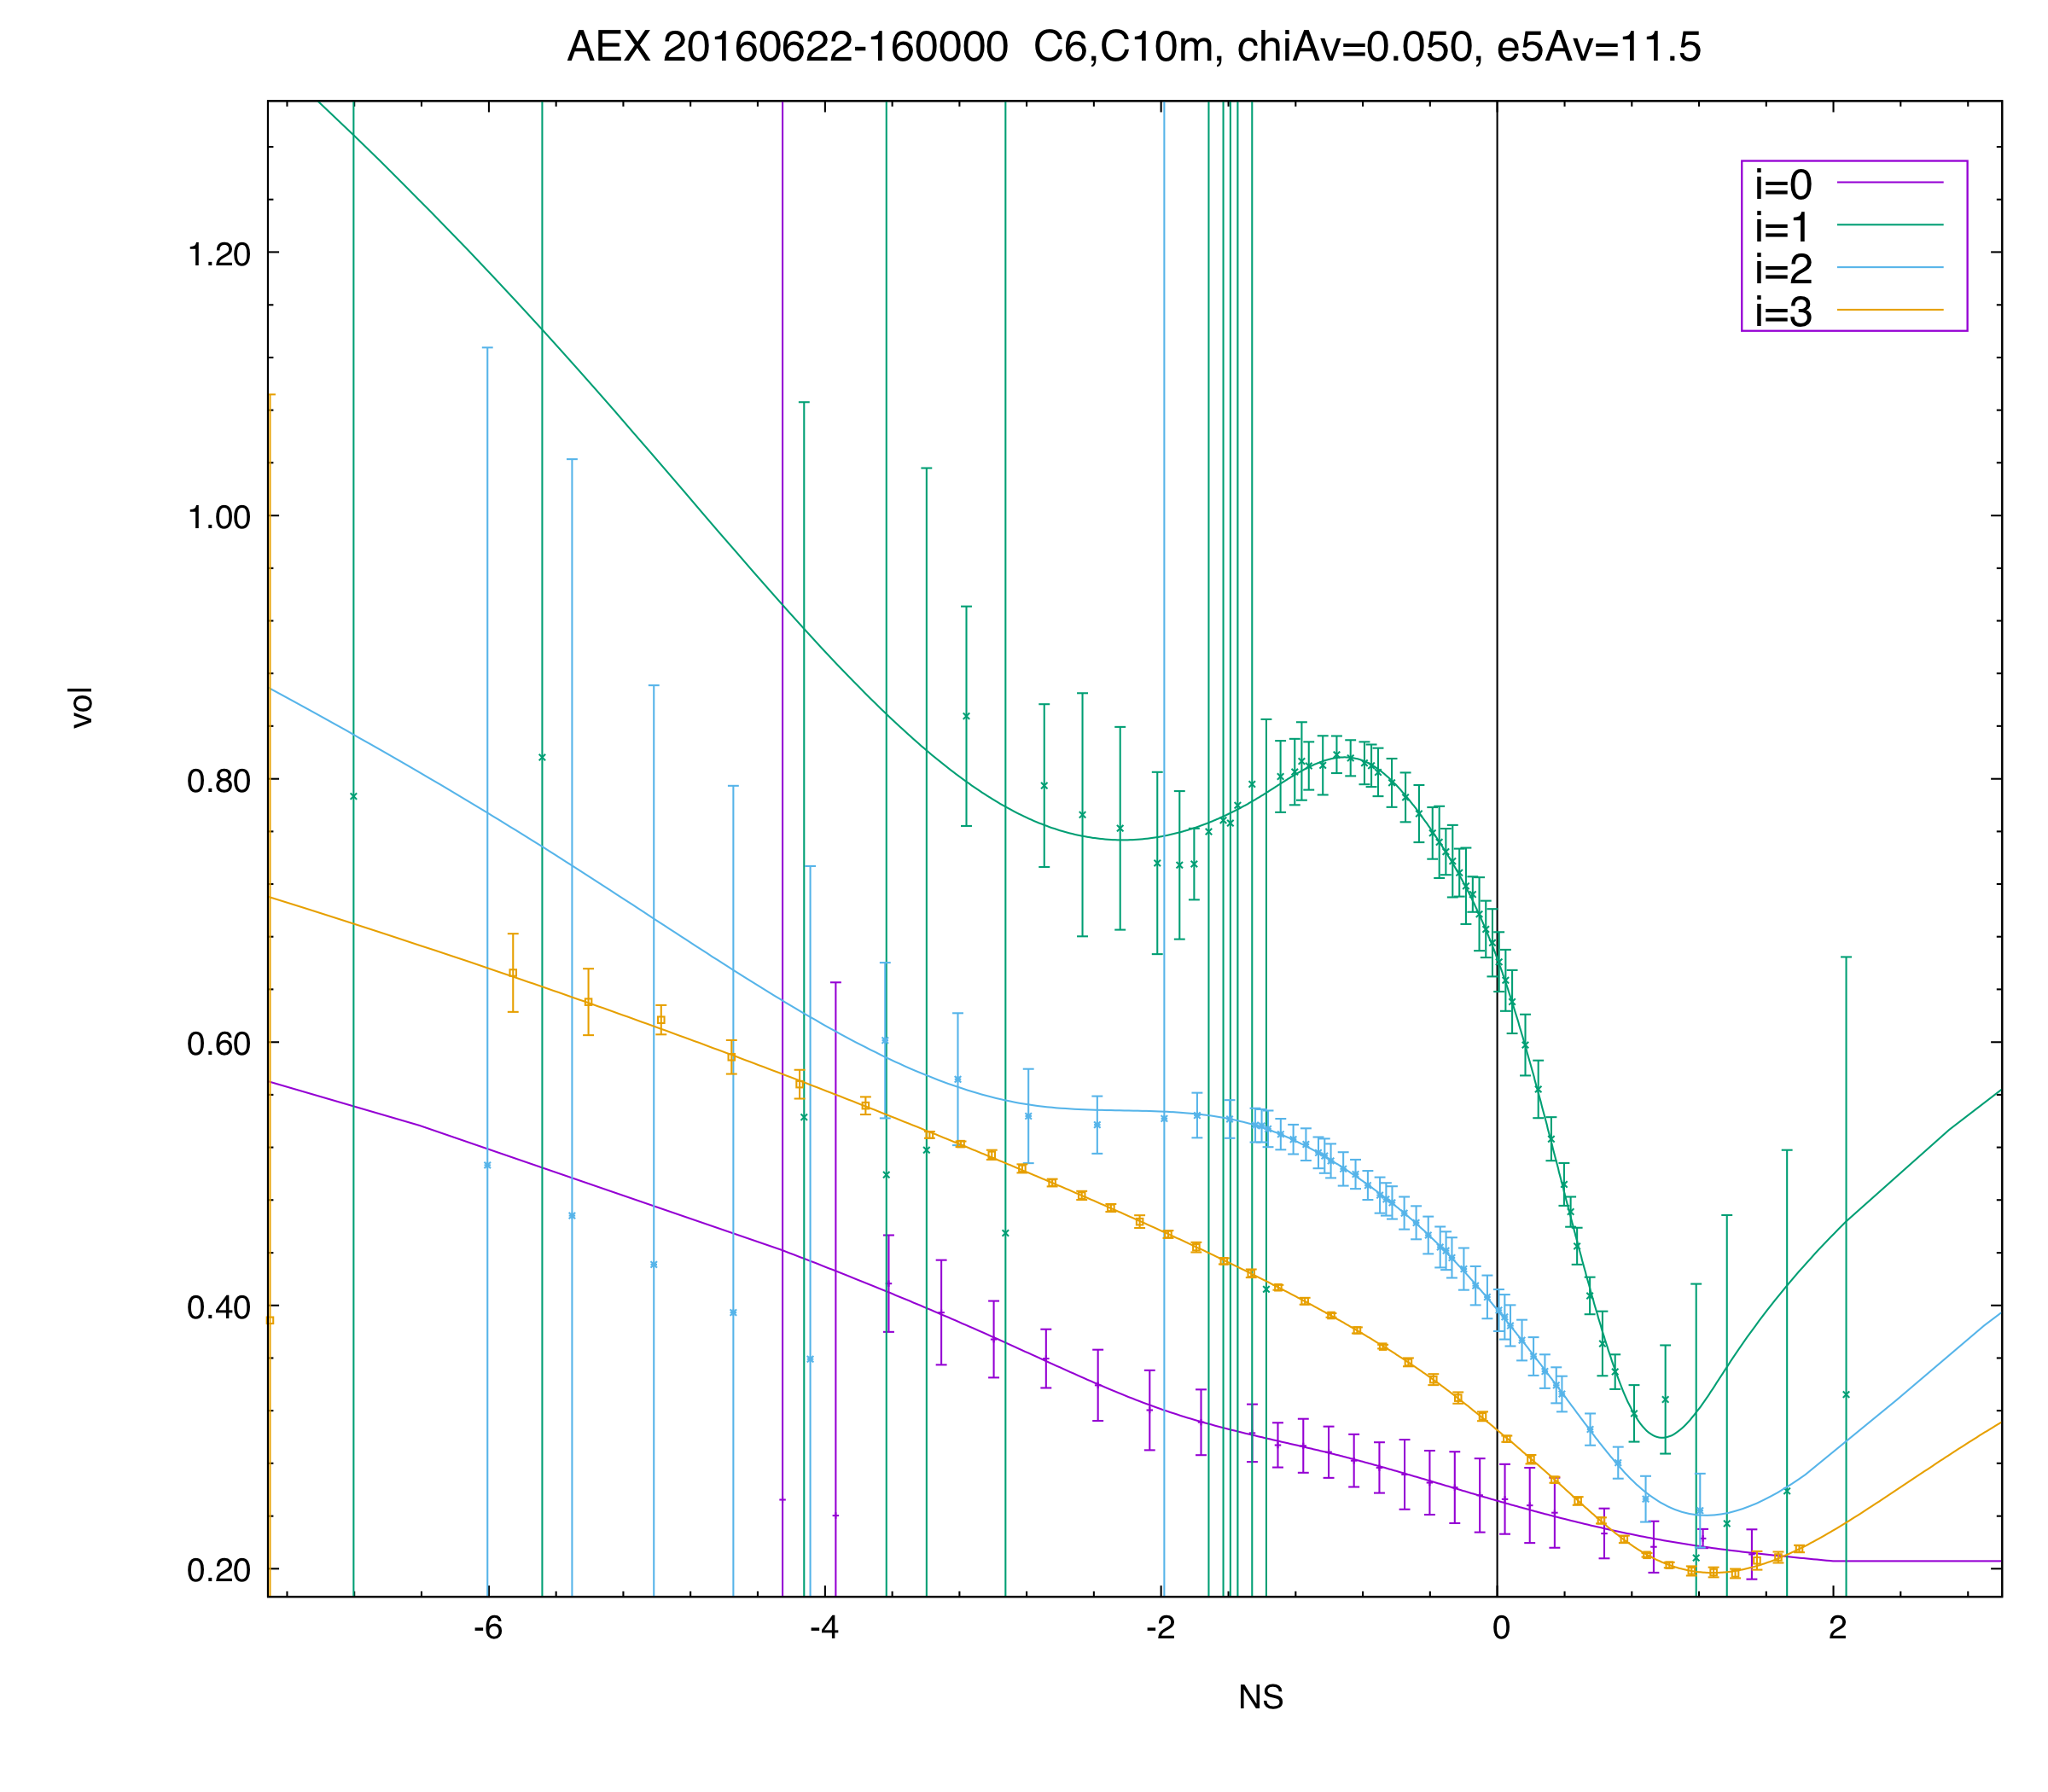
This plot shows vol as a function of normalized strike for the AEX (Amsterdam) index for the first four expiries, one day before the Brexit vote.
As of this snapshot, the first expiry (i=0) is on the day of the Brexit vote (before the result of the vote will be known), and the second expiry is the day after (i=1).
The 'waves' in the i=1 expiry (immediately after the voting result) reflect the market's weighted expectation of the different possible outcomes.
This is indeed a crazy curve! Note, however, that none of these curves has butterfly arbitrage, nor does the surface have any calendar arbitrage.
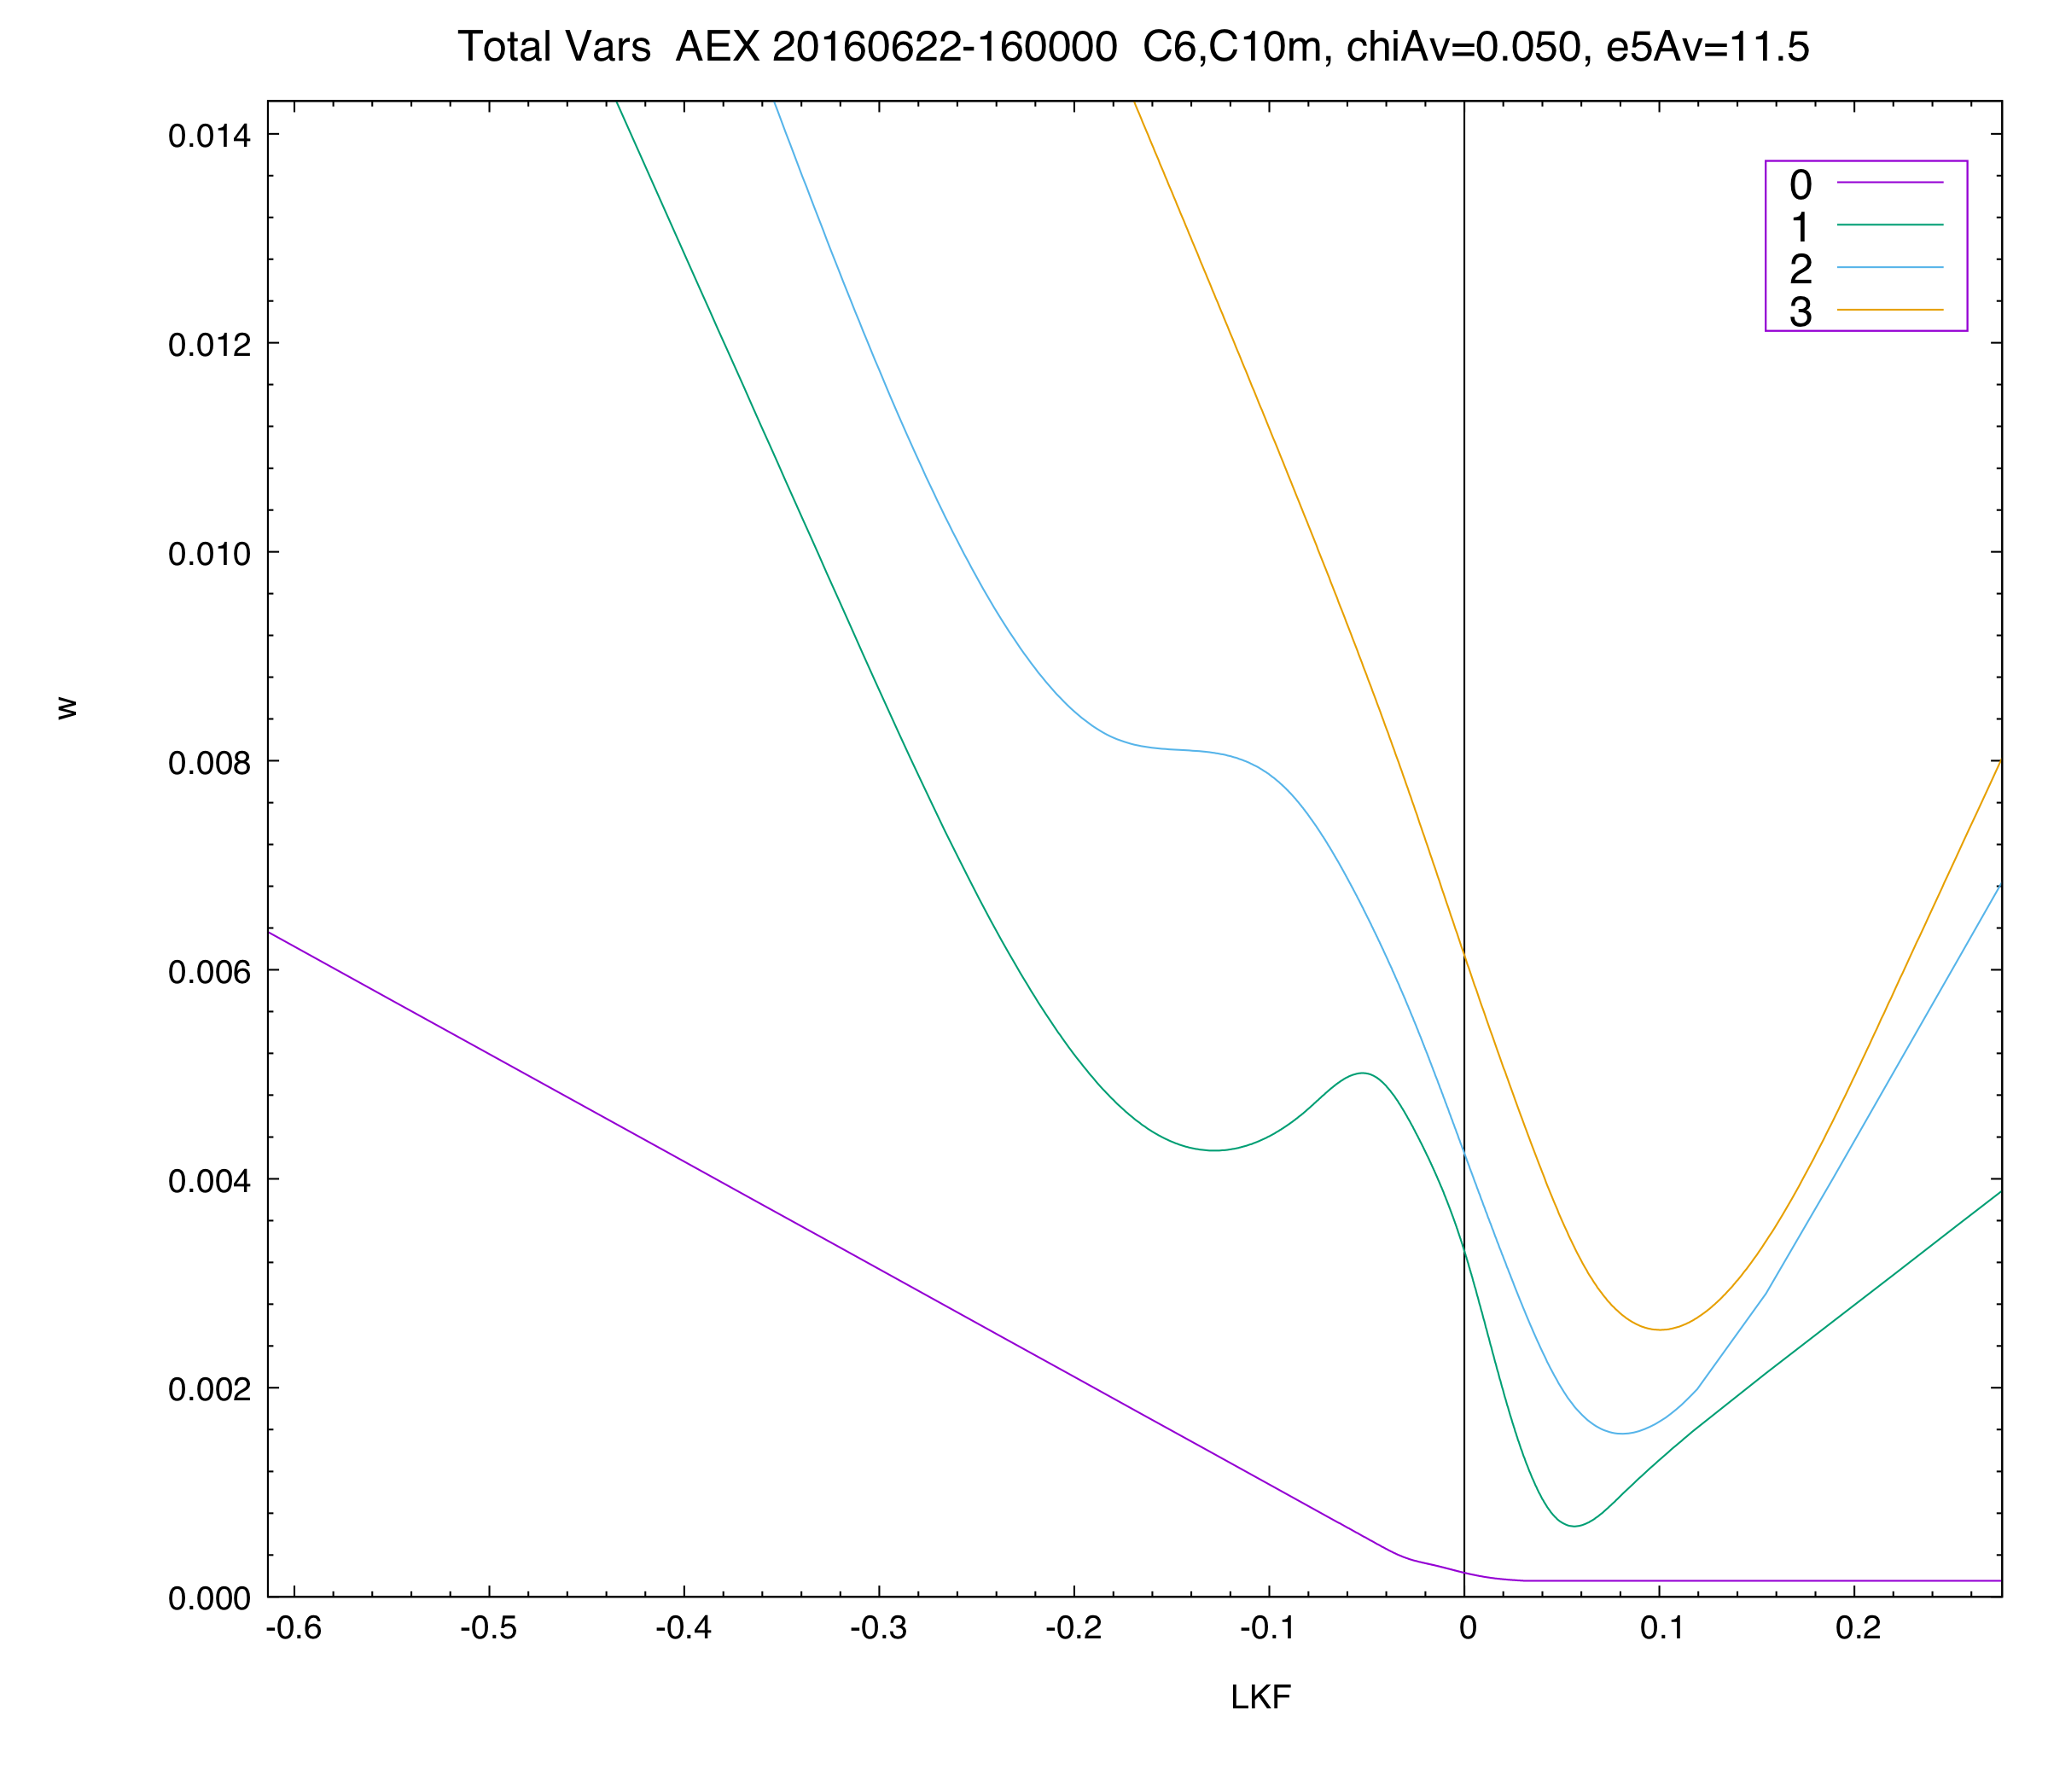
The lack of calendar arbitrage is illustrated in the next two plots.
The plot on the right shows the "total variance plot" for the AEX index for the first four expiries on this day.
The total implied variance is the Black-Scholes implied volatility squared times the time-to-expiry.
Plotting it as a function of log-moneyness, log(K/F), reveals whether there is calendar arbitrage. If at any fixed log-moneyness the variance is strictly increasing, there is no calendar arbitrage. As you can see, there is none here, even for this rather extreme market event.
Note that these fits were produced using the default settings for the fitter — no fiddling by-hand was performed. The user only needs to specify the curve types — and it is possible to choose different curve types for different expiries, as we did here.
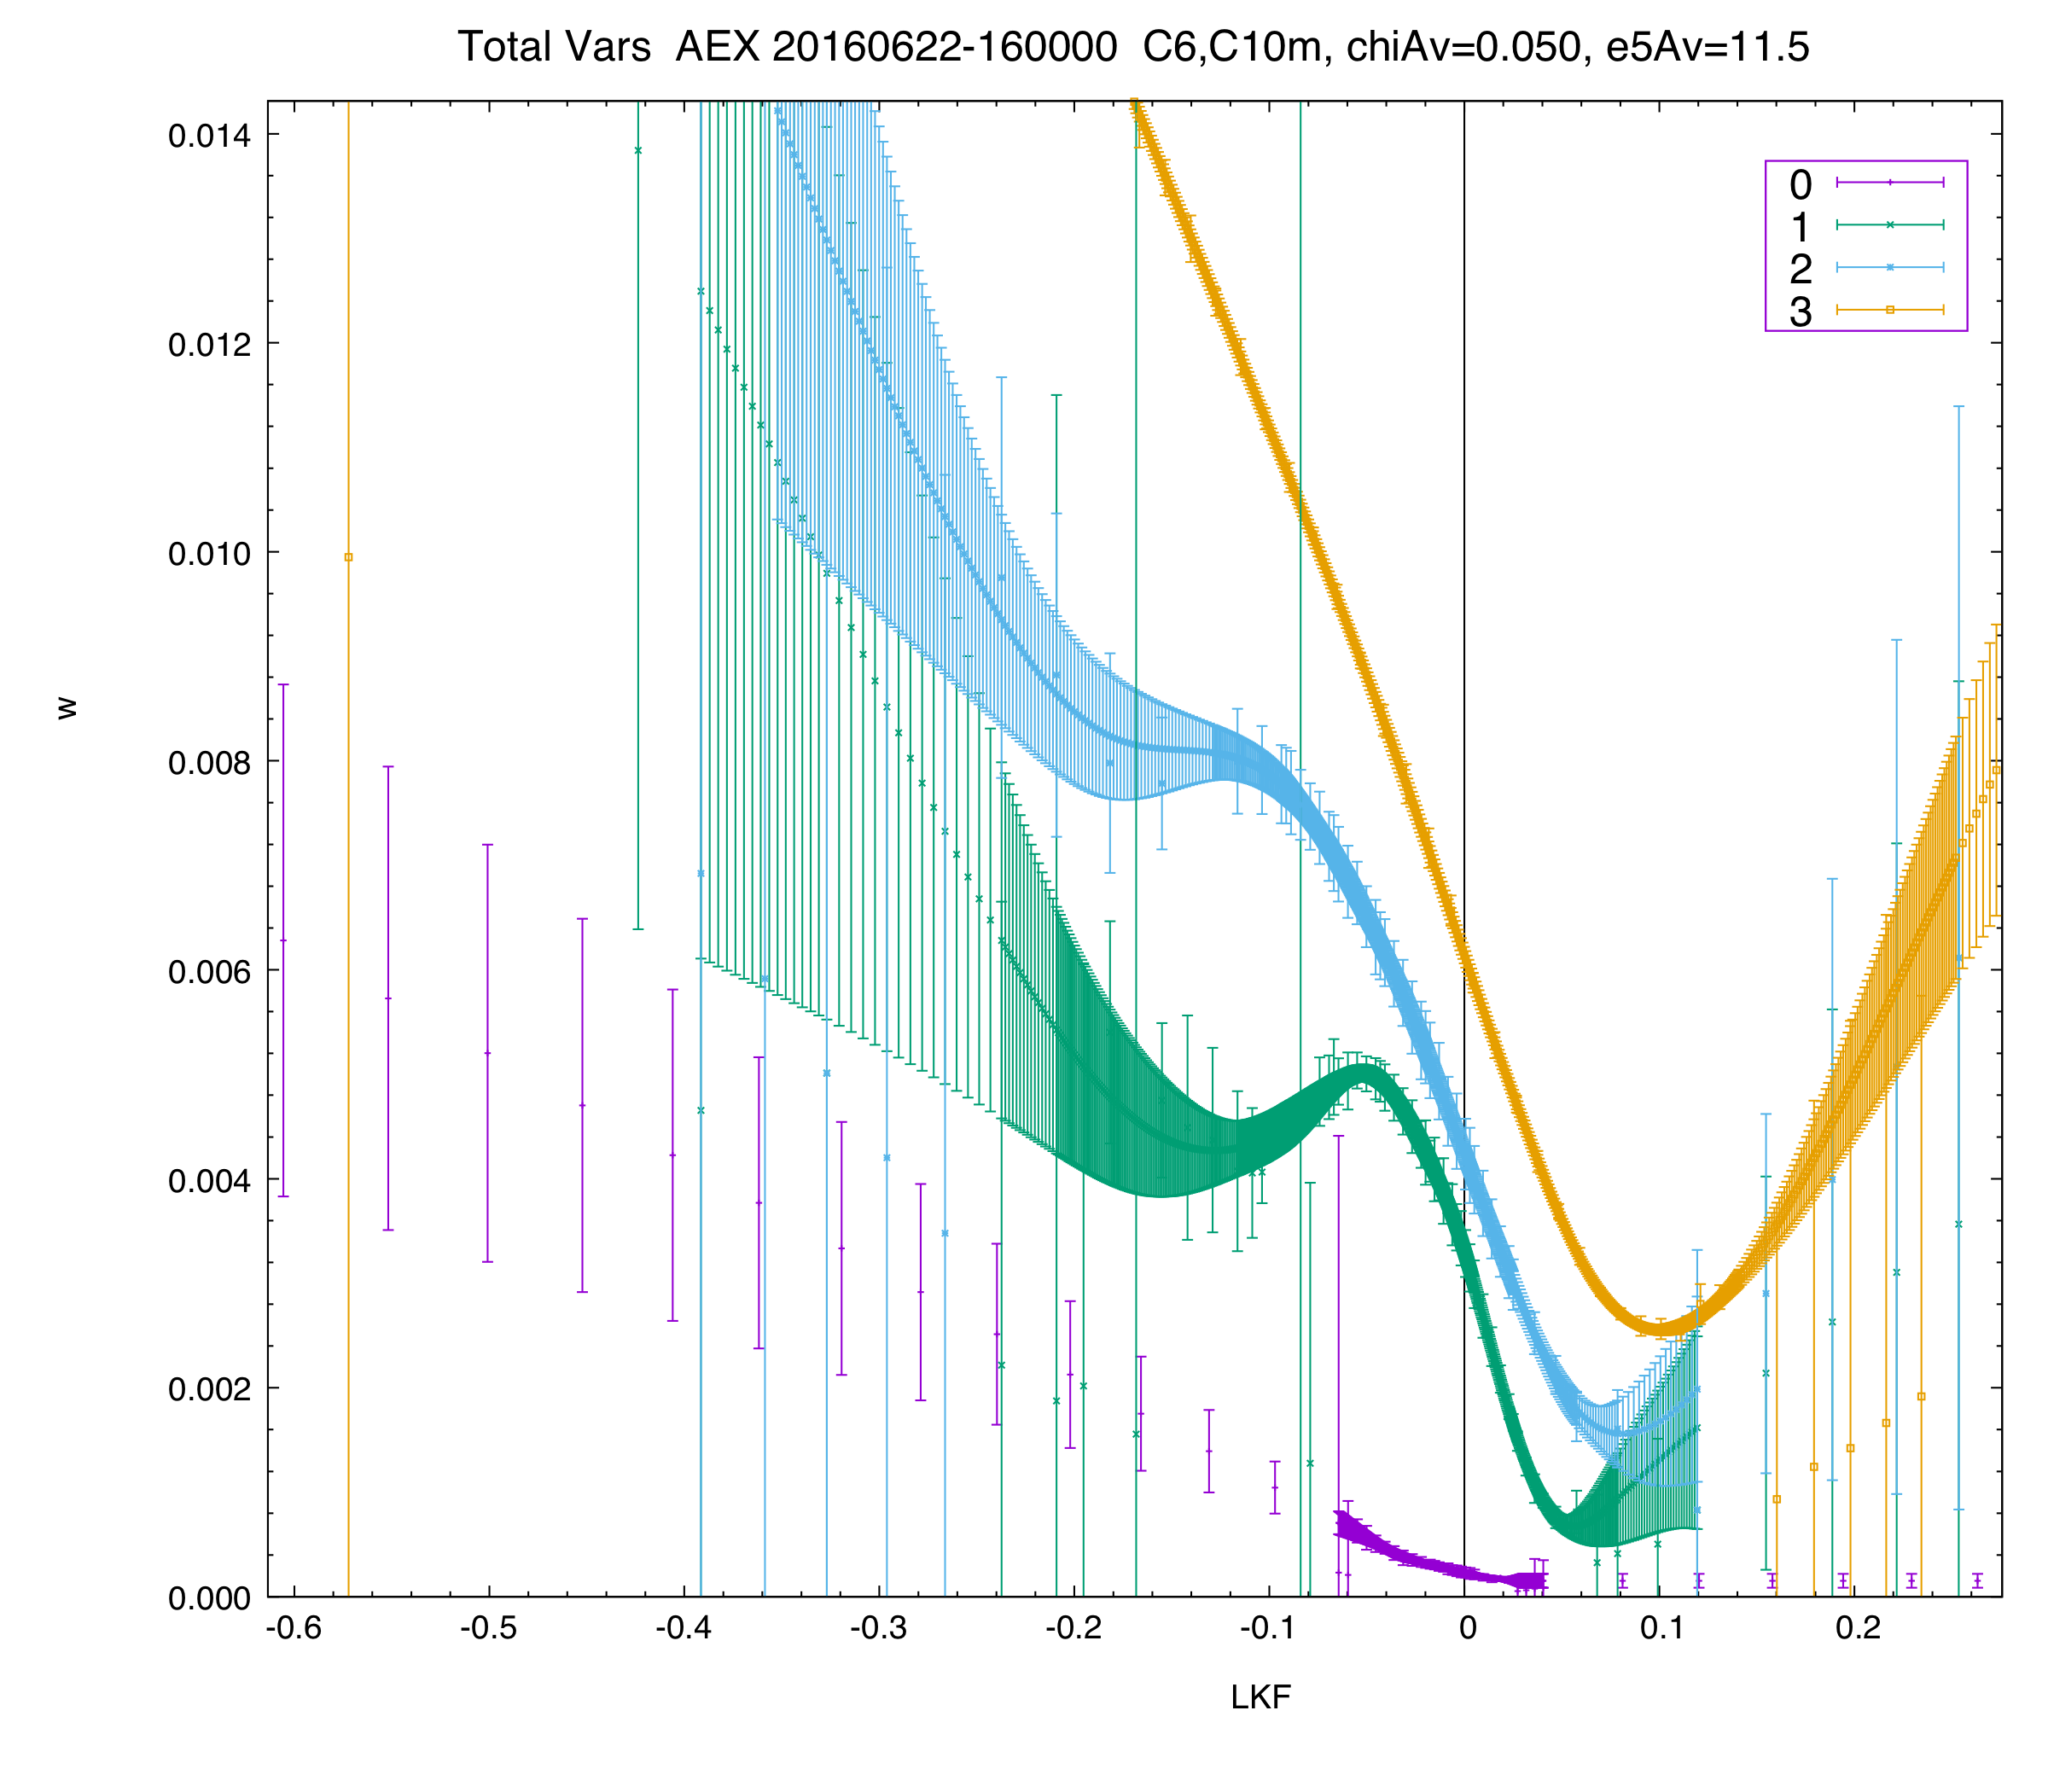
Finally, this plot is the same as the previous one, except here we show the input and output error bars.
The input error bars are the wider, "sporadic" ones. The output error bars are the smaller, "smooth" ones (illustrated on a set of densely-sampled, hypothetical strikes).
The input error bars are computed from the micro prices for bid and ask (in this case we use the naive inside bid/ask prices). Note that for a snapshot fit like here, the output error bars from the fitter are smaller than the input ones. This makes sense since we add extra information, namely that all implied vols should lie on a smooth curve as a function of strike.
Note that the output error bars are very useful as a component of a robust trading system, as they essentially provide a "minimum edge" requirement.
Error bars are especially useful when the market (or your data feed) behaves erratically. When option prices move inconsistently with the underlier and expected vol moves, the output error bars can be larger than the input error bars, providing a natural mechanism to keep you from making bad markets (better than a hard kill switch or trade halt).
The fit shown here was produced with default settings for the fitter — no fiddling by-hand was necessary. Ask us for more details.